> ## Documentation Index
> Fetch the complete documentation index at: https://tif1.tracinginsights.com/llms.txt
> Use this file to discover all available pages before exploring further.
# Complete Race Analysis
> End-to-end guide to analyzing a full race with tif1
This tutorial walks through a complete race analysis workflow, from loading data to generating insights about race pace, strategy, and performance.
 ## Setup
```python theme={"theme":{"light":"github-light","dark":"github-dark"}}
import tif1
import pandas as pd
import matplotlib.pyplot as plt
import seaborn as sns
# Configure plotting
tif1.plotting.setup_mpl(color_scheme="fastf1")
sns.set_style("darkgrid")
# Load race session
session = tif1.get_session(2024, "Abu Dhabi Grand Prix", "Race")
laps = session.laps
```
## 1. Race Overview
Start with a high-level overview of the race.
```python theme={"theme":{"light":"github-light","dark":"github-dark"}}
# Basic race statistics
print(f"Total laps: {laps['LapNumber'].max()}")
print(f"Drivers: {len(laps['Driver'].unique())}")
print(f"Total lap records: {len(laps)}")
# Race winner
final_lap = laps[laps["LapNumber"] == laps["LapNumber"].max()]
winner = final_lap.sort_values("Position").iloc[0]
print(f"\nRace Winner: {winner['Driver']} ({winner['Team']})")
# Fastest lap
fastest = laps.loc[laps["LapTime"].idxmin()]
print(f"Fastest Lap: {fastest['Driver']} - Lap {fastest['LapNumber']} - {fastest['LapTime']:.3f}s")
```
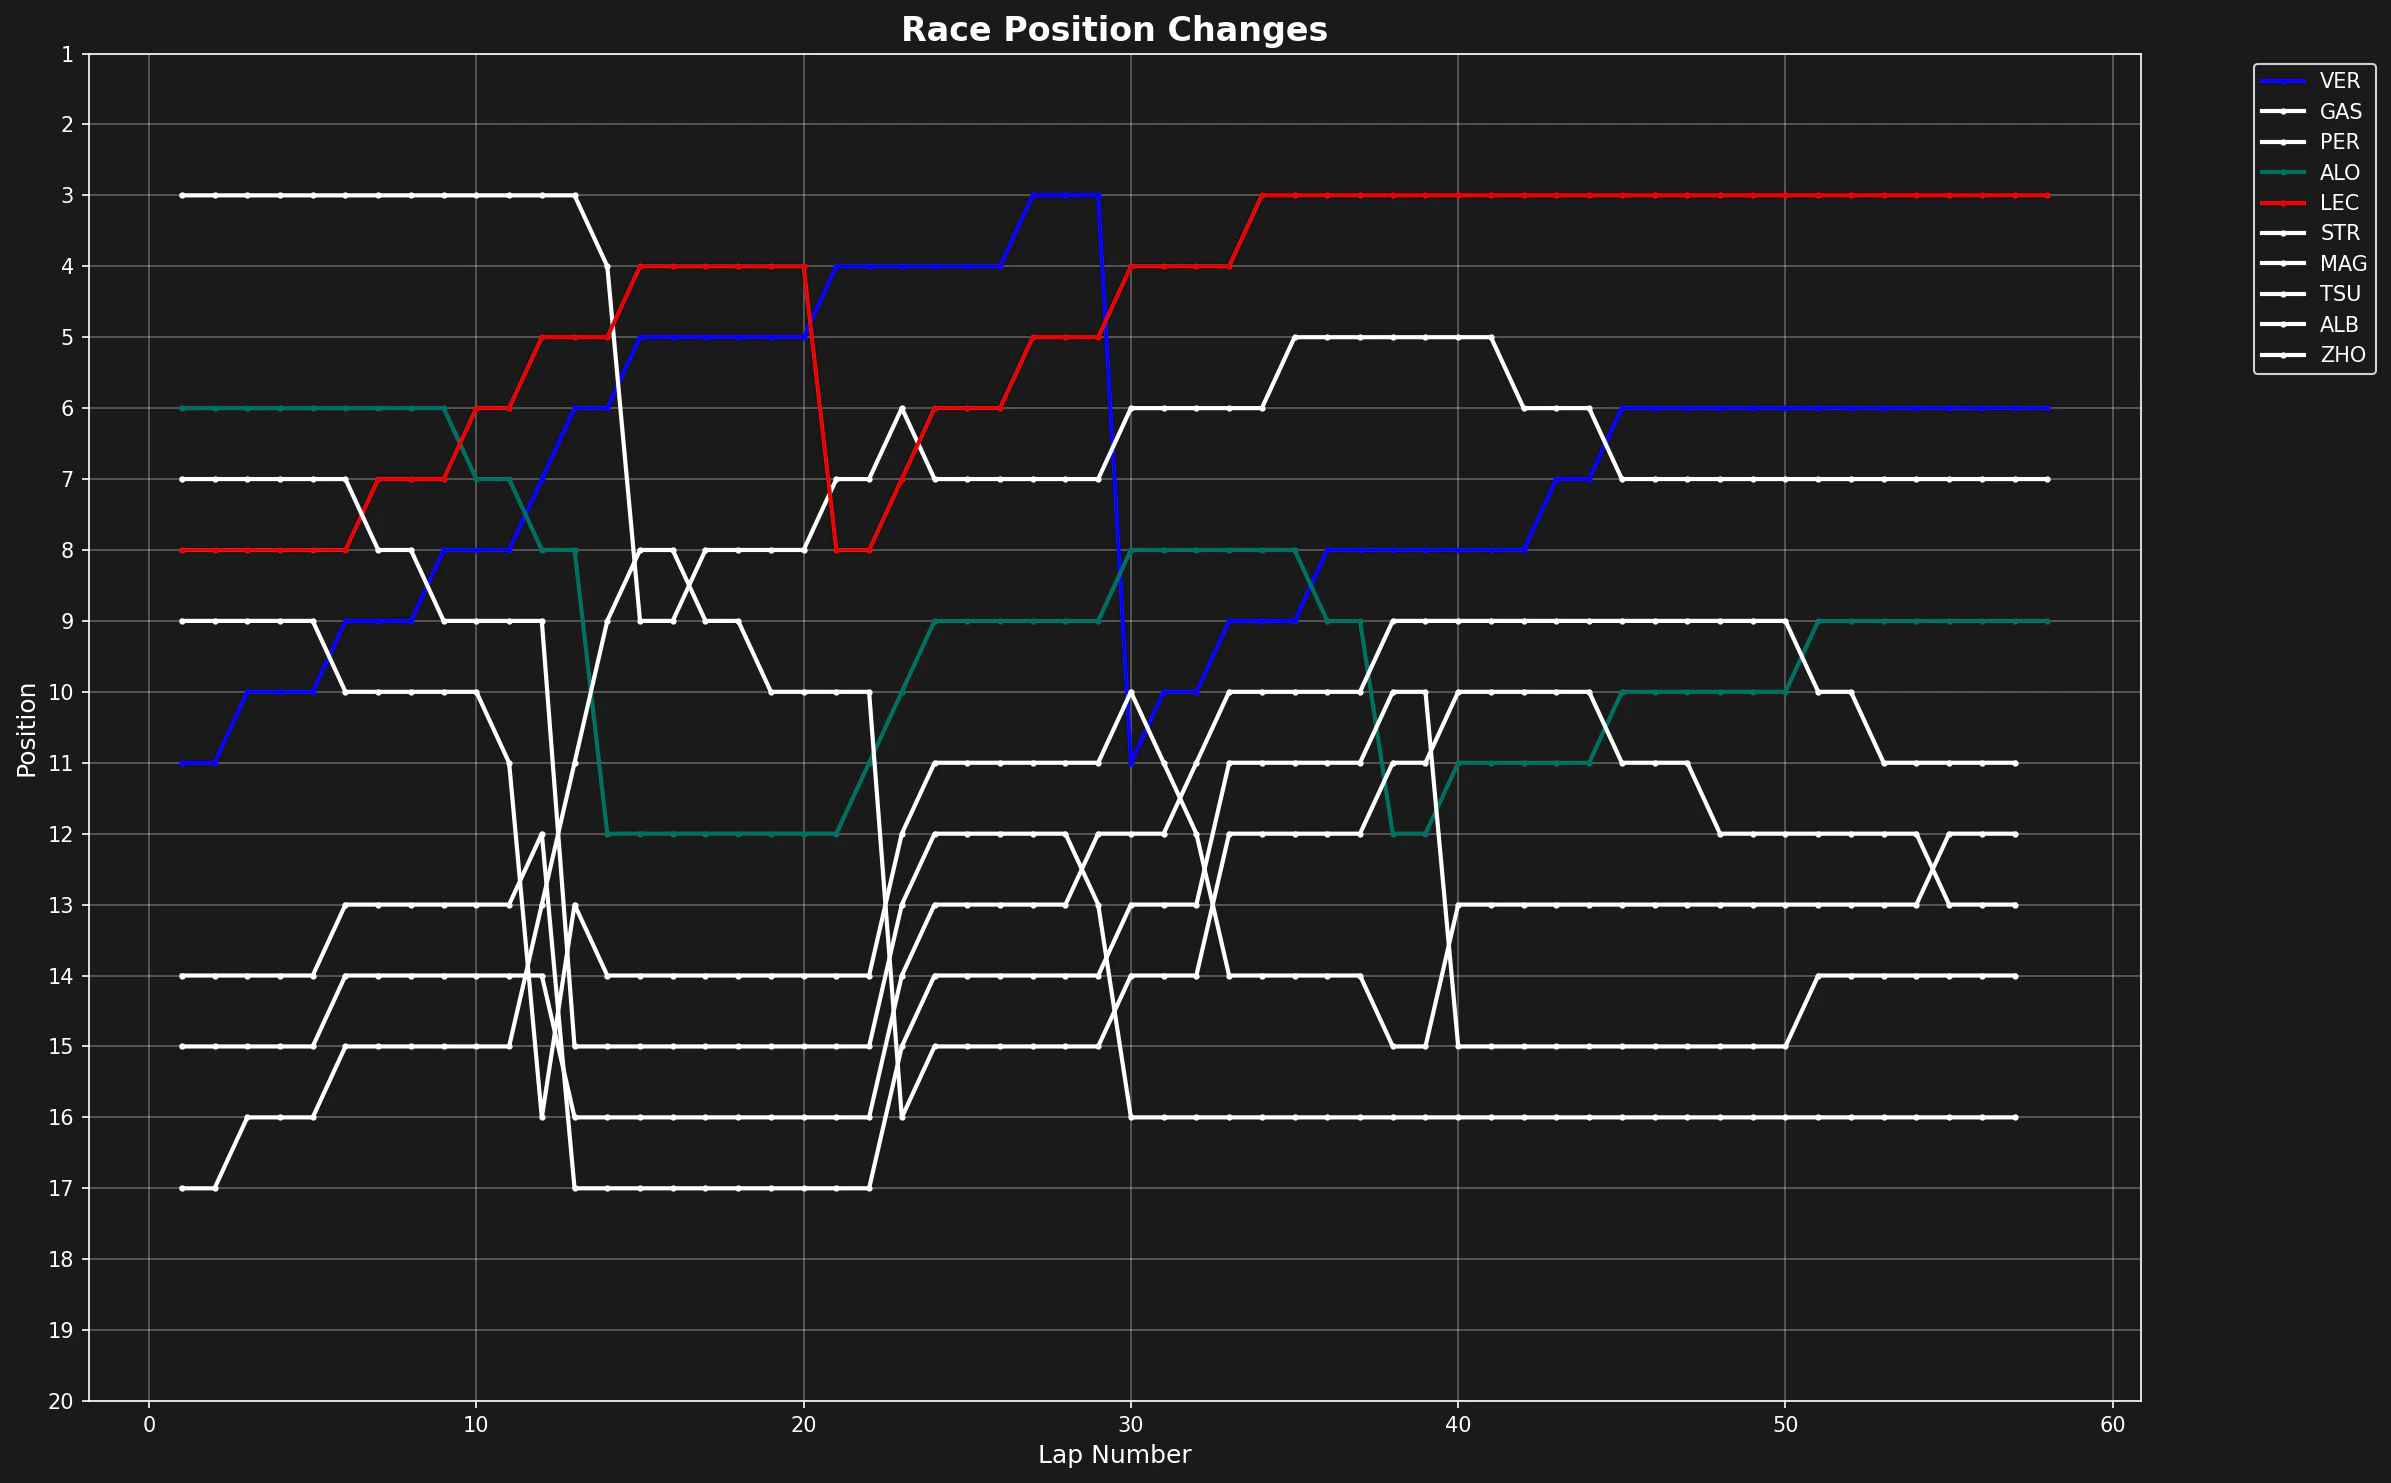
## 2. Position Changes
Visualize how positions changed throughout the race.
```python theme={"theme":{"light":"github-light","dark":"github-dark"}}
def plot_position_changes(laps):
"""Plot position changes for all drivers."""
fig, ax = plt.subplots(figsize=(16, 10))
colors = tif1.plotting.get_driver_color_mapping(session)
for driver in laps["Driver"].unique():
driver_laps = laps[laps["Driver"] == driver].sort_values("LapNumber")
ax.plot(
driver_laps["LapNumber"],
driver_laps["Position"],
label=driver,
color=colors.get(driver, "#ffffff"),
linewidth=2,
marker="o",
markersize=3
)
ax.set_xlabel("Lap Number", fontsize=12)
ax.set_ylabel("Position", fontsize=12)
ax.set_title("Race Position Changes", fontsize=16, fontweight="bold")
ax.invert_yaxis() # Position 1 at top
ax.set_yticks(range(1, 21))
ax.grid(True, alpha=0.3)
ax.legend(bbox_to_anchor=(1.05, 1), loc="upper left", fontsize=10)
plt.tight_layout()
plt.show()
plot_position_changes(laps)
```
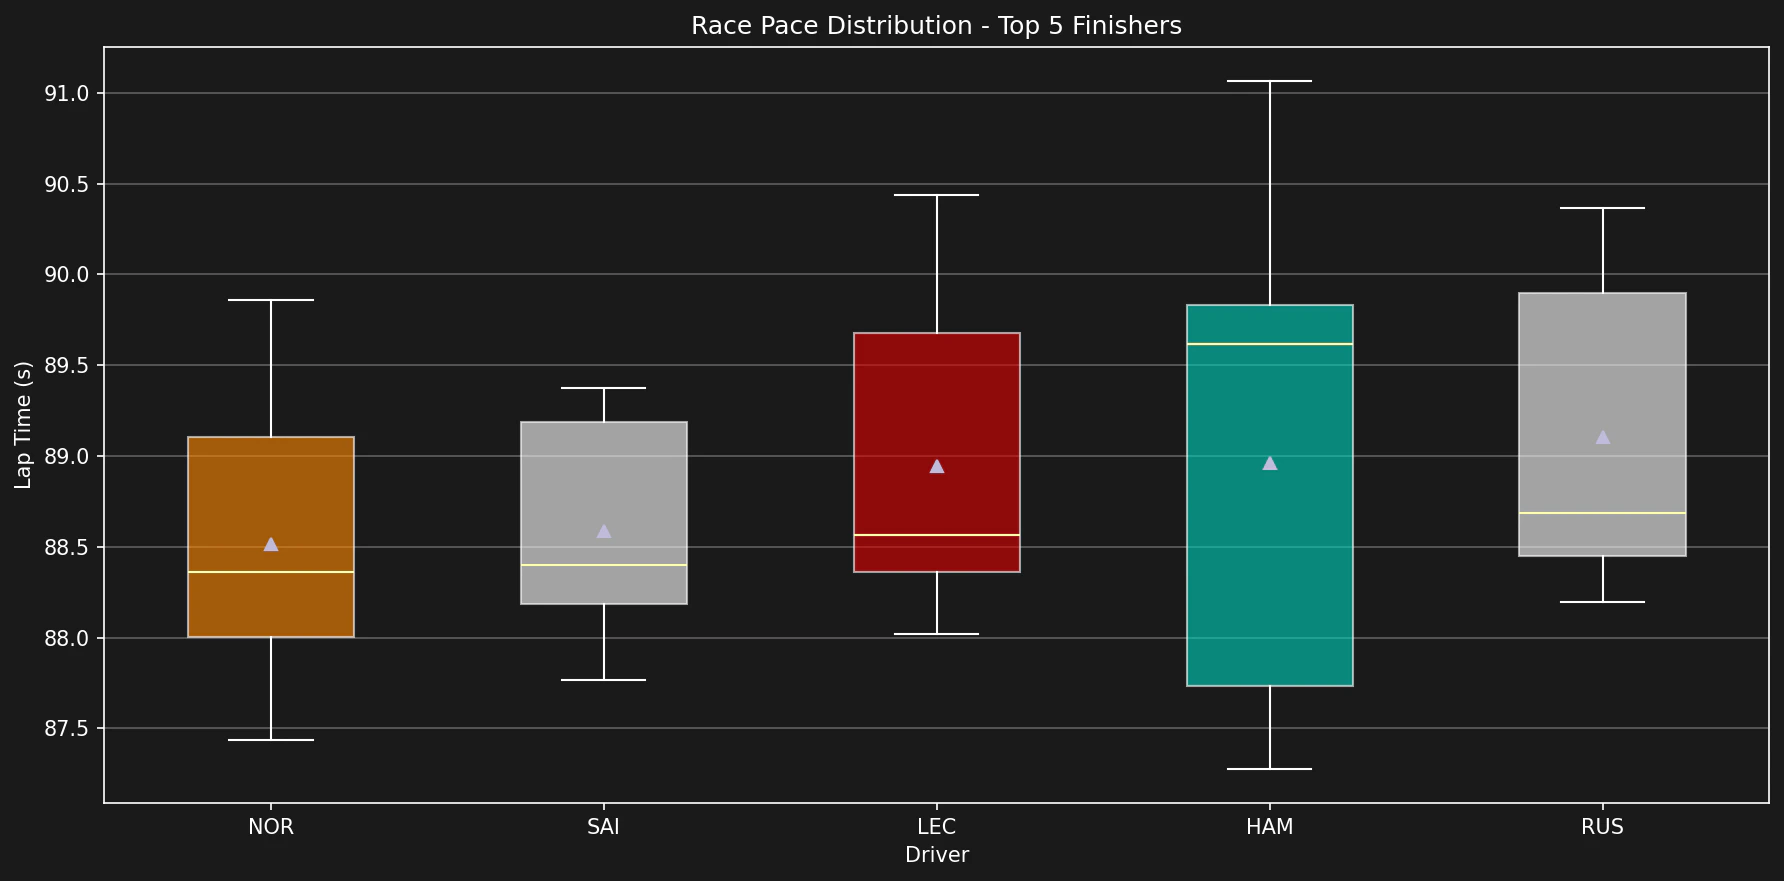
## 3. Lap Time Analysis
Analyze lap time distributions and consistency.
## Setup
```python theme={"theme":{"light":"github-light","dark":"github-dark"}}
import tif1
import pandas as pd
import matplotlib.pyplot as plt
import seaborn as sns
# Configure plotting
tif1.plotting.setup_mpl(color_scheme="fastf1")
sns.set_style("darkgrid")
# Load race session
session = tif1.get_session(2024, "Abu Dhabi Grand Prix", "Race")
laps = session.laps
```
## 1. Race Overview
Start with a high-level overview of the race.
```python theme={"theme":{"light":"github-light","dark":"github-dark"}}
# Basic race statistics
print(f"Total laps: {laps['LapNumber'].max()}")
print(f"Drivers: {len(laps['Driver'].unique())}")
print(f"Total lap records: {len(laps)}")
# Race winner
final_lap = laps[laps["LapNumber"] == laps["LapNumber"].max()]
winner = final_lap.sort_values("Position").iloc[0]
print(f"\nRace Winner: {winner['Driver']} ({winner['Team']})")
# Fastest lap
fastest = laps.loc[laps["LapTime"].idxmin()]
print(f"Fastest Lap: {fastest['Driver']} - Lap {fastest['LapNumber']} - {fastest['LapTime']:.3f}s")
```
## 2. Position Changes
Visualize how positions changed throughout the race.
```python theme={"theme":{"light":"github-light","dark":"github-dark"}}
def plot_position_changes(laps):
"""Plot position changes for all drivers."""
fig, ax = plt.subplots(figsize=(16, 10))
colors = tif1.plotting.get_driver_color_mapping(session)
for driver in laps["Driver"].unique():
driver_laps = laps[laps["Driver"] == driver].sort_values("LapNumber")
ax.plot(
driver_laps["LapNumber"],
driver_laps["Position"],
label=driver,
color=colors.get(driver, "#ffffff"),
linewidth=2,
marker="o",
markersize=3
)
ax.set_xlabel("Lap Number", fontsize=12)
ax.set_ylabel("Position", fontsize=12)
ax.set_title("Race Position Changes", fontsize=16, fontweight="bold")
ax.invert_yaxis() # Position 1 at top
ax.set_yticks(range(1, 21))
ax.grid(True, alpha=0.3)
ax.legend(bbox_to_anchor=(1.05, 1), loc="upper left", fontsize=10)
plt.tight_layout()
plt.show()
plot_position_changes(laps)
```
## 3. Lap Time Analysis
Analyze lap time distributions and consistency.
 ```python theme={"theme":{"light":"github-light","dark":"github-dark"}}
def clean_race_laps(laps):
"""Remove invalid laps for race pace analysis."""
clean = laps.copy()
# Remove pit laps
clean = clean[clean["PitInTime"].isna() & clean["PitOutTime"].isna()]
# Remove lap 1 (standing start)
clean = clean[clean["LapNumber"] > 1]
# Remove very slow laps (safety car, incidents)
fastest = clean["LapTime"].min()
clean = clean[clean["LapTime"] < fastest * 1.15]
# Remove deleted laps
clean = clean[~clean["Deleted"]]
return clean
clean_laps = clean_race_laps(laps)
# Top 5 finishers
final_positions = laps[laps["LapNumber"] == laps["LapNumber"].max()].sort_values("Position")
top_5_drivers = final_positions.head(5)["Driver"].tolist()
# Box plot of lap times
fig, ax = plt.subplots(figsize=(12, 6))
top_5_laps = clean_laps[clean_laps["Driver"].isin(top_5_drivers)]
colors_list = [tif1.plotting.get_driver_color(d) for d in top_5_drivers]
bp = ax.boxplot(
[top_5_laps[top_5_laps["Driver"] == d]["LapTime"] for d in top_5_drivers],
labels=top_5_drivers,
patch_artist=True,
showmeans=True
)
for patch, color in zip(bp["boxes"], colors_list):
patch.set_facecolor(color)
patch.set_alpha(0.6)
ax.set_xlabel("Driver")
ax.set_ylabel("Lap Time (s)")
ax.set_title("Race Pace Distribution - Top 5 Finishers")
ax.grid(True, alpha=0.3, axis="y")
plt.tight_layout()
plt.show()
```
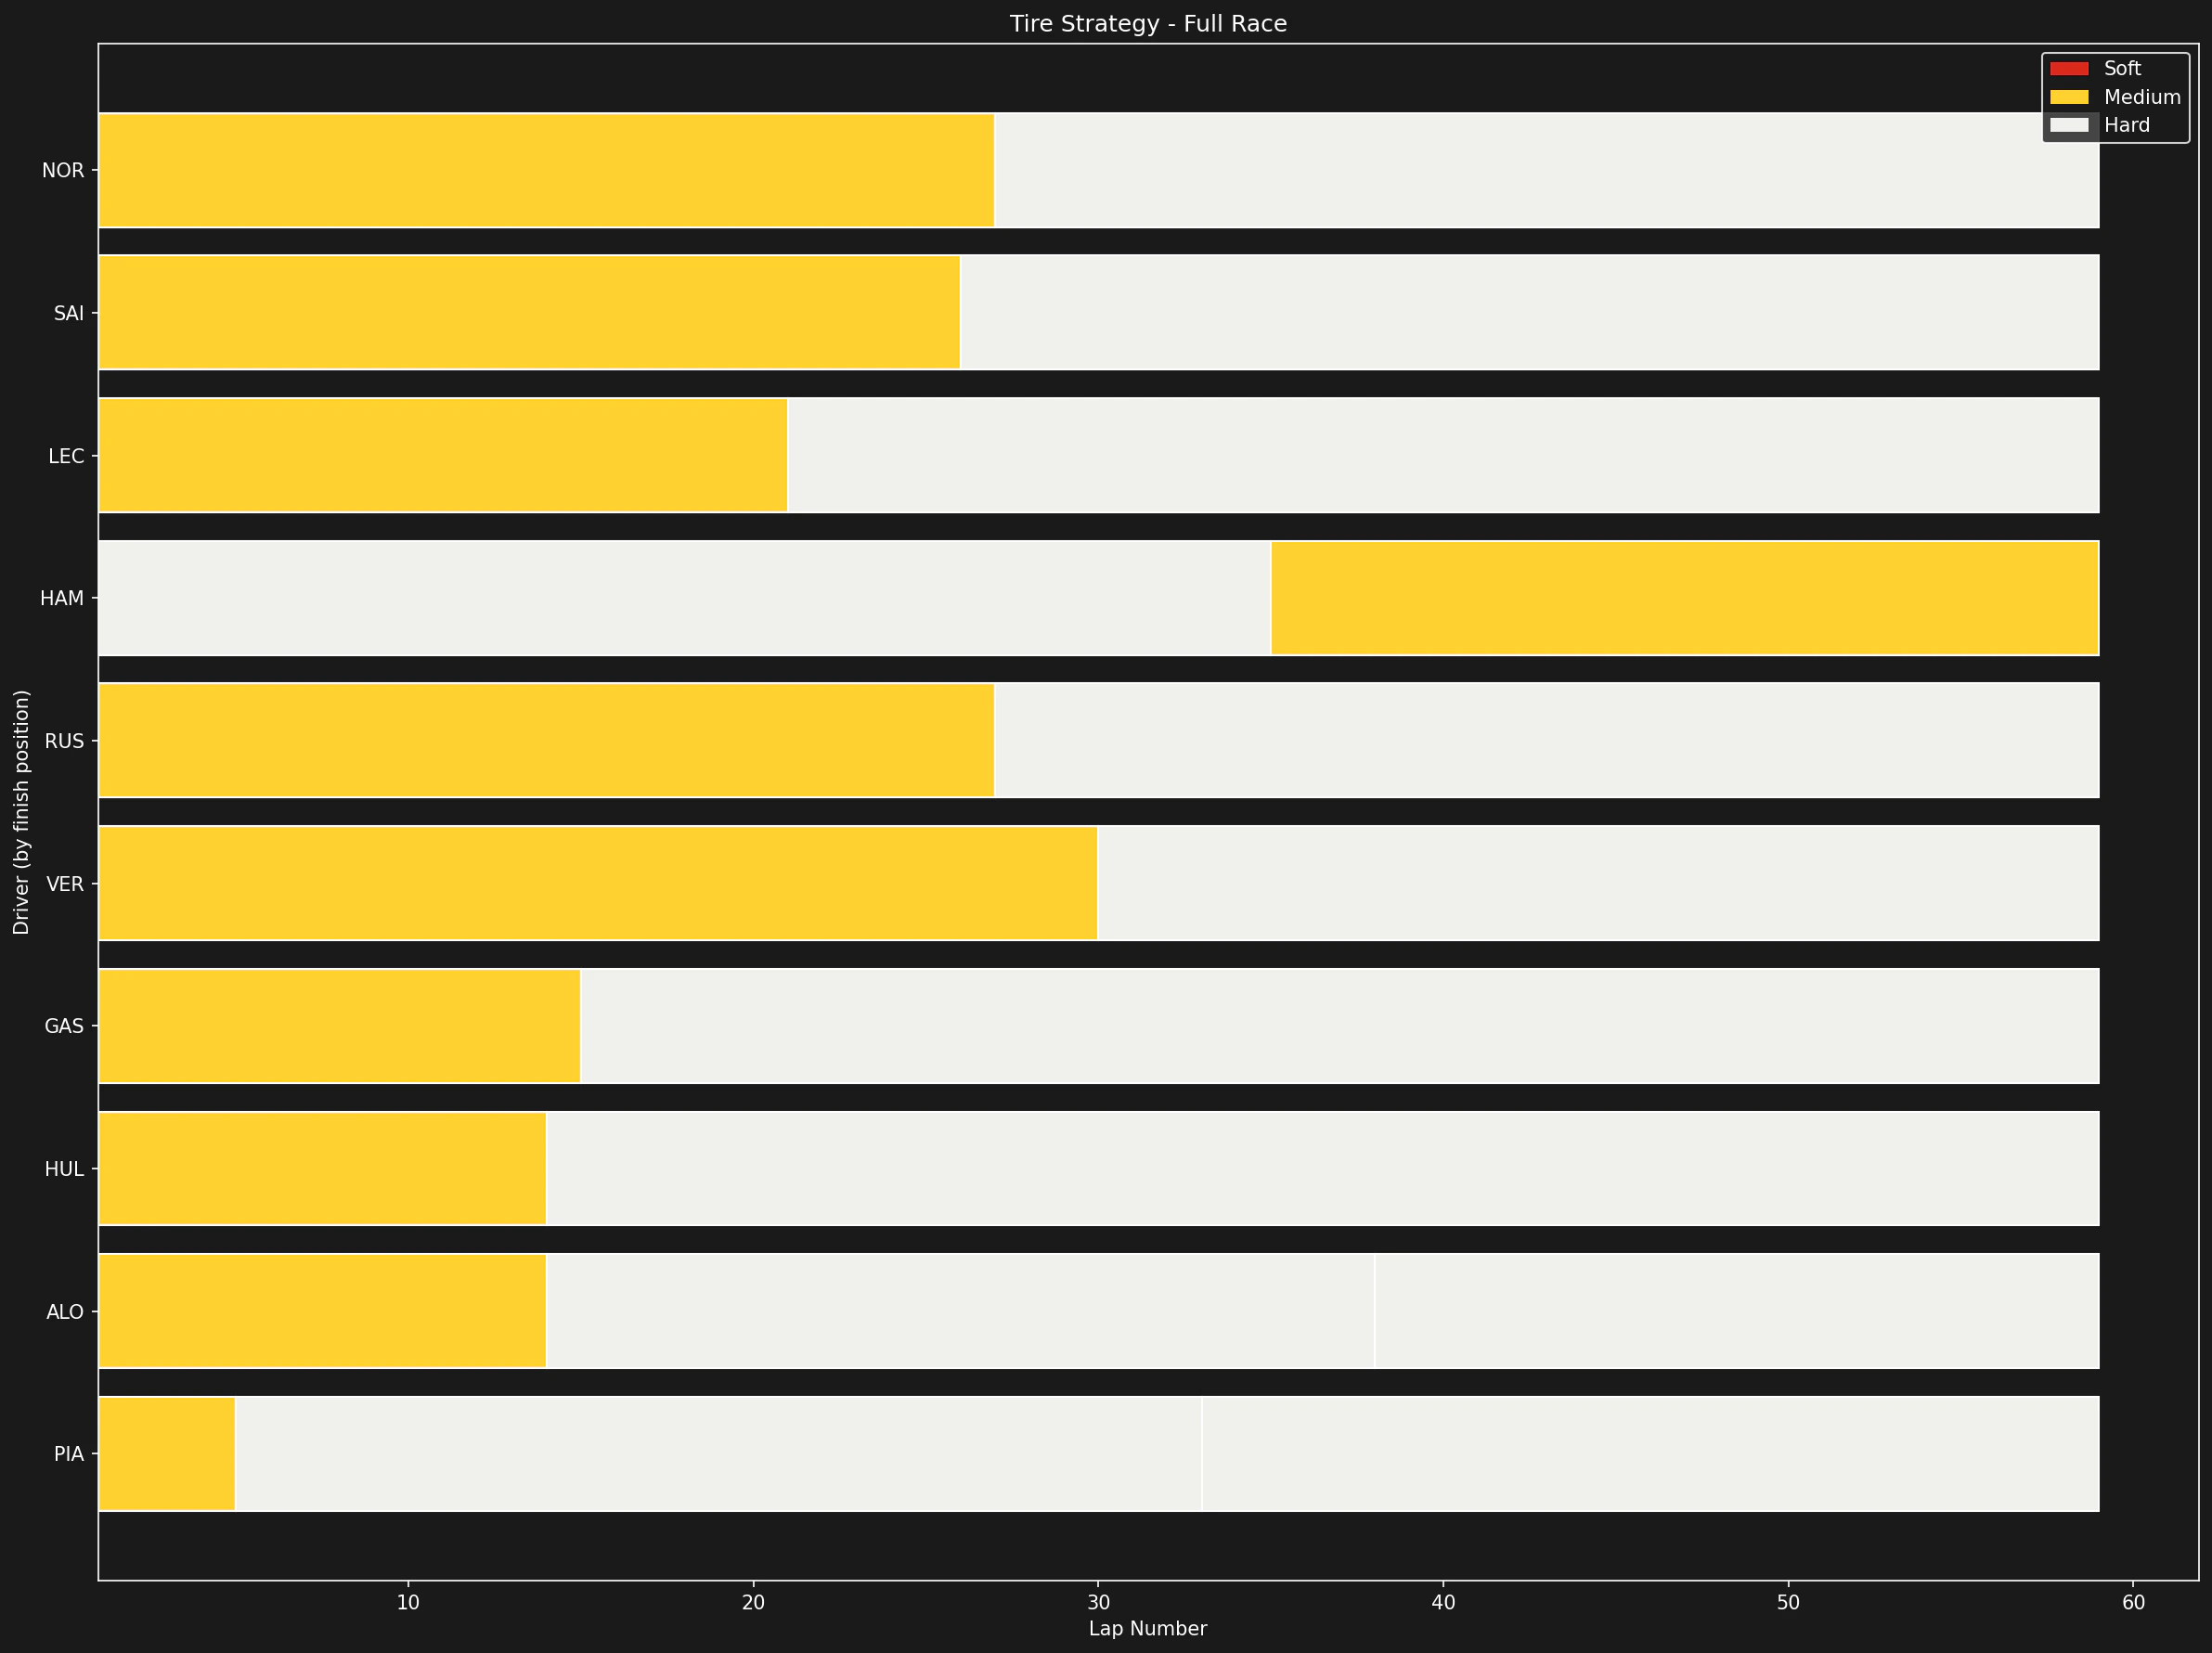
## 4. Tire Strategy
Analyze tire strategy and stint lengths.
```python theme={"theme":{"light":"github-light","dark":"github-dark"}}
def clean_race_laps(laps):
"""Remove invalid laps for race pace analysis."""
clean = laps.copy()
# Remove pit laps
clean = clean[clean["PitInTime"].isna() & clean["PitOutTime"].isna()]
# Remove lap 1 (standing start)
clean = clean[clean["LapNumber"] > 1]
# Remove very slow laps (safety car, incidents)
fastest = clean["LapTime"].min()
clean = clean[clean["LapTime"] < fastest * 1.15]
# Remove deleted laps
clean = clean[~clean["Deleted"]]
return clean
clean_laps = clean_race_laps(laps)
# Top 5 finishers
final_positions = laps[laps["LapNumber"] == laps["LapNumber"].max()].sort_values("Position")
top_5_drivers = final_positions.head(5)["Driver"].tolist()
# Box plot of lap times
fig, ax = plt.subplots(figsize=(12, 6))
top_5_laps = clean_laps[clean_laps["Driver"].isin(top_5_drivers)]
colors_list = [tif1.plotting.get_driver_color(d) for d in top_5_drivers]
bp = ax.boxplot(
[top_5_laps[top_5_laps["Driver"] == d]["LapTime"] for d in top_5_drivers],
labels=top_5_drivers,
patch_artist=True,
showmeans=True
)
for patch, color in zip(bp["boxes"], colors_list):
patch.set_facecolor(color)
patch.set_alpha(0.6)
ax.set_xlabel("Driver")
ax.set_ylabel("Lap Time (s)")
ax.set_title("Race Pace Distribution - Top 5 Finishers")
ax.grid(True, alpha=0.3, axis="y")
plt.tight_layout()
plt.show()
```
## 4. Tire Strategy
Analyze tire strategy and stint lengths.
 ```python theme={"theme":{"light":"github-light","dark":"github-dark"}}
def plot_tire_strategy(laps):
"""Visualize tire strategy for all drivers."""
fig, ax = plt.subplots(figsize=(16, 12))
# Get final classification
final_lap = laps[laps["LapNumber"] == laps["LapNumber"].max()]
drivers_sorted = final_lap.sort_values("Position")["Driver"].tolist()
compound_colors = tif1.plotting.get_compound_mapping()
for idx, driver in enumerate(drivers_sorted):
driver_laps = laps[laps["Driver"] == driver].sort_values("LapNumber")
for stint in driver_laps["Stint"].unique():
stint_laps = driver_laps[driver_laps["Stint"] == stint]
compound = stint_laps["Compound"].iloc[0]
start_lap = stint_laps["LapNumber"].min()
end_lap = stint_laps["LapNumber"].max()
ax.barh(
y=idx,
width=end_lap - start_lap + 1,
left=start_lap,
height=0.8,
color=compound_colors.get(compound, "#888888"),
edgecolor="white",
linewidth=1
)
ax.set_yticks(range(len(drivers_sorted)))
ax.set_yticklabels(drivers_sorted)
ax.set_xlabel("Lap Number")
ax.set_ylabel("Driver (by finish position)")
ax.set_title("Tire Strategy - Full Race")
ax.invert_yaxis()
# Legend
from matplotlib.patches import Patch
legend_elements = [
Patch(facecolor=compound_colors["SOFT"], label="Soft"),
Patch(facecolor=compound_colors["MEDIUM"], label="Medium"),
Patch(facecolor=compound_colors["HARD"], label="Hard"),
]
ax.legend(handles=legend_elements, loc="upper right")
plt.tight_layout()
plt.show()
plot_tire_strategy(laps)
```
## 5. Stint Analysis
Analyze tire degradation within stints.
```python theme={"theme":{"light":"github-light","dark":"github-dark"}}
def analyze_stint_degradation(laps, driver, stint):
"""Analyze tire degradation for a specific stint."""
stint_laps = laps[
(laps["Driver"] == driver) &
(laps["Stint"] == stint) &
(laps["PitInTime"].isna())
].copy()
if len(stint_laps) < 3:
return None
# Linear regression
from scipy import stats
slope, intercept, r_value, _, _ = stats.linregress(
stint_laps["TyreLife"],
stint_laps["LapTime"]
)
return {
"driver": driver,
"stint": stint,
"compound": stint_laps["Compound"].iloc[0],
"laps": len(stint_laps),
"degradation": slope,
"r_squared": r_value ** 2,
"avg_time": stint_laps["LapTime"].mean(),
}
# Analyze all stints for top 3
results = []
for driver in top_5_drivers[:3]:
driver_laps = laps[laps["Driver"] == driver]
for stint in driver_laps["Stint"].unique():
result = analyze_stint_degradation(laps, driver, stint)
if result:
results.append(result)
# Display results
import pandas as pd
df_results = pd.DataFrame(results)
print("\nStint Degradation Analysis:")
print(df_results.to_string(index=False))
```
## 6. Gap to Leader
Calculate and visualize gap to race leader over time.
```python theme={"theme":{"light":"github-light","dark":"github-dark"}}
def calculate_gap_to_leader(laps):
"""Calculate gap to leader for each lap."""
gaps = []
for lap_num in laps["LapNumber"].unique():
lap_data = laps[laps["LapNumber"] == lap_num].copy()
# Find leader
leader = lap_data[lap_data["Position"] == 1]
if len(leader) == 0:
continue
leader_time = leader["SessionTime"].iloc[0]
# Calculate gaps
for _, row in lap_data.iterrows():
gap = row["SessionTime"] - leader_time
gaps.append({
"LapNumber": lap_num,
"Driver": row["Driver"],
"Position": row["Position"],
"GapToLeader": gap,
})
return pd.DataFrame(gaps)
gaps_df = calculate_gap_to_leader(laps)
# Plot gap evolution for top 5
fig, ax = plt.subplots(figsize=(16, 8))
colors = tif1.plotting.get_driver_color_mapping(session)
for driver in top_5_drivers:
driver_gaps = gaps_df[gaps_df["Driver"] == driver]
ax.plot(
driver_gaps["LapNumber"],
driver_gaps["GapToLeader"],
label=driver,
color=colors.get(driver, "#ffffff"),
linewidth=2
)
ax.set_xlabel("Lap Number")
ax.set_ylabel("Gap to Leader (s)")
ax.set_title("Gap to Leader - Top 5 Finishers")
ax.legend()
ax.grid(True, alpha=0.3)
plt.tight_layout()
plt.show()
```
## 7. Pit Stop Analysis
Analyze pit stop timing and duration.
```python theme={"theme":{"light":"github-light","dark":"github-dark"}}
def analyze_pit_stops(laps):
"""Extract and analyze pit stop data."""
pit_stops = []
for driver in laps["Driver"].unique():
driver_laps = laps[laps["Driver"] == driver].sort_values("LapNumber")
# Find pit laps (where PitInTime is not null)
pit_laps = driver_laps[driver_laps["PitInTime"].notna()]
for _, pit_lap in pit_laps.iterrows():
pit_stops.append({
"Driver": driver,
"Lap": pit_lap["LapNumber"],
"PitInTime": pit_lap["PitInTime"],
"PitOutTime": pit_lap["PitOutTime"],
"Duration": pit_lap["PitOutTime"] - pit_lap["PitInTime"] if pd.notna(pit_lap["PitOutTime"]) else None,
"Stint": pit_lap["Stint"],
})
return pd.DataFrame(pit_stops)
pit_stops_df = analyze_pit_stops(laps)
if len(pit_stops_df) > 0:
print("\nPit Stop Summary:")
print(f"Total pit stops: {len(pit_stops_df)}")
print(f"Average duration: {pit_stops_df['Duration'].mean():.2f}s")
print(f"Fastest stop: {pit_stops_df['Duration'].min():.2f}s")
print(f"Slowest stop: {pit_stops_df['Duration'].max():.2f}s")
# Plot pit stop timing
fig, ax = plt.subplots(figsize=(14, 8))
colors = tif1.plotting.get_driver_color_mapping(session)
for driver in top_5_drivers:
driver_stops = pit_stops_df[pit_stops_df["Driver"] == driver]
if len(driver_stops) > 0:
ax.scatter(
driver_stops["Lap"],
[driver] * len(driver_stops),
s=200,
color=colors.get(driver, "#ffffff"),
edgecolor="white",
linewidth=2,
zorder=3
)
ax.set_xlabel("Lap Number")
ax.set_ylabel("Driver")
ax.set_title("Pit Stop Timing - Top 5 Finishers")
ax.grid(True, alpha=0.3, axis="x")
plt.tight_layout()
plt.show()
```
## 8. Race Pace Comparison
Compare race pace between drivers on same compound.
```python theme={"theme":{"light":"github-light","dark":"github-dark"}}
def compare_race_pace(laps, drivers, compound="MEDIUM"):
"""Compare race pace for specific drivers on same compound."""
fig, ax = plt.subplots(figsize=(14, 6))
colors = tif1.plotting.get_driver_color_mapping(session)
for driver in drivers:
driver_laps = clean_laps[
(clean_laps["Driver"] == driver) &
(clean_laps["Compound"] == compound)
].copy()
if len(driver_laps) == 0:
continue
# Plot lap times vs tire life
ax.scatter(
driver_laps["TyreLife"],
driver_laps["LapTime"],
color=colors.get(driver, "#ffffff"),
label=driver,
alpha=0.6,
s=50
)
# Add trend line
if len(driver_laps) >= 3:
from scipy import stats
slope, intercept, _, _, _ = stats.linregress(
driver_laps["TyreLife"],
driver_laps["LapTime"]
)
x_trend = range(int(driver_laps["TyreLife"].min()), int(driver_laps["TyreLife"].max()) + 1)
y_trend = [slope * x + intercept for x in x_trend]
ax.plot(x_trend, y_trend, color=colors.get(driver, "#ffffff"), linestyle="--", alpha=0.8)
ax.set_xlabel("Tire Life (laps)")
ax.set_ylabel("Lap Time (s)")
ax.set_title(f"Race Pace Comparison - {compound} Compound")
ax.legend()
ax.grid(True, alpha=0.3)
plt.tight_layout()
plt.show()
compare_race_pace(laps, top_5_drivers[:3], compound="MEDIUM")
```
## 9. Generate Race Report
Create a comprehensive race summary.
```python theme={"theme":{"light":"github-light","dark":"github-dark"}}
def generate_race_report(session, laps):
"""Generate a comprehensive race report."""
print("=" * 60)
print(f"RACE REPORT: {session.event['EventName']} {session.year}")
print("=" * 60)
# Winner
final_lap = laps[laps["LapNumber"] == laps["LapNumber"].max()]
winner = final_lap.sort_values("Position").iloc[0]
print(f"\n🏆 Winner: {winner['Driver']} ({winner['Team']})")
# Fastest lap
fastest = laps.loc[laps["LapTime"].idxmin()]
print(f"⚡ Fastest Lap: {fastest['Driver']} - Lap {fastest['LapNumber']} - {fastest['LapTime']:.3f}s")
# Race statistics
print(f"\n📊 Race Statistics:")
print(f" Total Laps: {laps['LapNumber'].max()}")
print(f" Classified Finishers: {len(final_lap)}")
# Pit stops
pit_stops = laps[laps["PitInTime"].notna()]
print(f" Total Pit Stops: {len(pit_stops)}")
# Top 5
print(f"\n🏁 Top 5 Finishers:")
top_5 = final_lap.sort_values("Position").head(5)
for _, driver in top_5.iterrows():
print(f" {int(driver['Position'])}. {driver['Driver']} ({driver['Team']})")
print("\n" + "=" * 60)
generate_race_report(session, laps)
```
## Summary
This complete race analysis workflow covers:
1. Race overview and basic statistics
2. Position changes throughout the race
3. Lap time analysis and consistency
4. Tire strategy visualization
5. Stint-by-stint degradation analysis
6. Gap to leader tracking
7. Pit stop analysis
8. Race pace comparison
9. Comprehensive race report
You can adapt these patterns to analyze any race in the tif1 database (2018-current).
***
## Related Pages
Analyze qualifying
Weather analysis
API reference
More examples
```python theme={"theme":{"light":"github-light","dark":"github-dark"}}
def plot_tire_strategy(laps):
"""Visualize tire strategy for all drivers."""
fig, ax = plt.subplots(figsize=(16, 12))
# Get final classification
final_lap = laps[laps["LapNumber"] == laps["LapNumber"].max()]
drivers_sorted = final_lap.sort_values("Position")["Driver"].tolist()
compound_colors = tif1.plotting.get_compound_mapping()
for idx, driver in enumerate(drivers_sorted):
driver_laps = laps[laps["Driver"] == driver].sort_values("LapNumber")
for stint in driver_laps["Stint"].unique():
stint_laps = driver_laps[driver_laps["Stint"] == stint]
compound = stint_laps["Compound"].iloc[0]
start_lap = stint_laps["LapNumber"].min()
end_lap = stint_laps["LapNumber"].max()
ax.barh(
y=idx,
width=end_lap - start_lap + 1,
left=start_lap,
height=0.8,
color=compound_colors.get(compound, "#888888"),
edgecolor="white",
linewidth=1
)
ax.set_yticks(range(len(drivers_sorted)))
ax.set_yticklabels(drivers_sorted)
ax.set_xlabel("Lap Number")
ax.set_ylabel("Driver (by finish position)")
ax.set_title("Tire Strategy - Full Race")
ax.invert_yaxis()
# Legend
from matplotlib.patches import Patch
legend_elements = [
Patch(facecolor=compound_colors["SOFT"], label="Soft"),
Patch(facecolor=compound_colors["MEDIUM"], label="Medium"),
Patch(facecolor=compound_colors["HARD"], label="Hard"),
]
ax.legend(handles=legend_elements, loc="upper right")
plt.tight_layout()
plt.show()
plot_tire_strategy(laps)
```
## 5. Stint Analysis
Analyze tire degradation within stints.
```python theme={"theme":{"light":"github-light","dark":"github-dark"}}
def analyze_stint_degradation(laps, driver, stint):
"""Analyze tire degradation for a specific stint."""
stint_laps = laps[
(laps["Driver"] == driver) &
(laps["Stint"] == stint) &
(laps["PitInTime"].isna())
].copy()
if len(stint_laps) < 3:
return None
# Linear regression
from scipy import stats
slope, intercept, r_value, _, _ = stats.linregress(
stint_laps["TyreLife"],
stint_laps["LapTime"]
)
return {
"driver": driver,
"stint": stint,
"compound": stint_laps["Compound"].iloc[0],
"laps": len(stint_laps),
"degradation": slope,
"r_squared": r_value ** 2,
"avg_time": stint_laps["LapTime"].mean(),
}
# Analyze all stints for top 3
results = []
for driver in top_5_drivers[:3]:
driver_laps = laps[laps["Driver"] == driver]
for stint in driver_laps["Stint"].unique():
result = analyze_stint_degradation(laps, driver, stint)
if result:
results.append(result)
# Display results
import pandas as pd
df_results = pd.DataFrame(results)
print("\nStint Degradation Analysis:")
print(df_results.to_string(index=False))
```
## 6. Gap to Leader
Calculate and visualize gap to race leader over time.
```python theme={"theme":{"light":"github-light","dark":"github-dark"}}
def calculate_gap_to_leader(laps):
"""Calculate gap to leader for each lap."""
gaps = []
for lap_num in laps["LapNumber"].unique():
lap_data = laps[laps["LapNumber"] == lap_num].copy()
# Find leader
leader = lap_data[lap_data["Position"] == 1]
if len(leader) == 0:
continue
leader_time = leader["SessionTime"].iloc[0]
# Calculate gaps
for _, row in lap_data.iterrows():
gap = row["SessionTime"] - leader_time
gaps.append({
"LapNumber": lap_num,
"Driver": row["Driver"],
"Position": row["Position"],
"GapToLeader": gap,
})
return pd.DataFrame(gaps)
gaps_df = calculate_gap_to_leader(laps)
# Plot gap evolution for top 5
fig, ax = plt.subplots(figsize=(16, 8))
colors = tif1.plotting.get_driver_color_mapping(session)
for driver in top_5_drivers:
driver_gaps = gaps_df[gaps_df["Driver"] == driver]
ax.plot(
driver_gaps["LapNumber"],
driver_gaps["GapToLeader"],
label=driver,
color=colors.get(driver, "#ffffff"),
linewidth=2
)
ax.set_xlabel("Lap Number")
ax.set_ylabel("Gap to Leader (s)")
ax.set_title("Gap to Leader - Top 5 Finishers")
ax.legend()
ax.grid(True, alpha=0.3)
plt.tight_layout()
plt.show()
```
## 7. Pit Stop Analysis
Analyze pit stop timing and duration.
```python theme={"theme":{"light":"github-light","dark":"github-dark"}}
def analyze_pit_stops(laps):
"""Extract and analyze pit stop data."""
pit_stops = []
for driver in laps["Driver"].unique():
driver_laps = laps[laps["Driver"] == driver].sort_values("LapNumber")
# Find pit laps (where PitInTime is not null)
pit_laps = driver_laps[driver_laps["PitInTime"].notna()]
for _, pit_lap in pit_laps.iterrows():
pit_stops.append({
"Driver": driver,
"Lap": pit_lap["LapNumber"],
"PitInTime": pit_lap["PitInTime"],
"PitOutTime": pit_lap["PitOutTime"],
"Duration": pit_lap["PitOutTime"] - pit_lap["PitInTime"] if pd.notna(pit_lap["PitOutTime"]) else None,
"Stint": pit_lap["Stint"],
})
return pd.DataFrame(pit_stops)
pit_stops_df = analyze_pit_stops(laps)
if len(pit_stops_df) > 0:
print("\nPit Stop Summary:")
print(f"Total pit stops: {len(pit_stops_df)}")
print(f"Average duration: {pit_stops_df['Duration'].mean():.2f}s")
print(f"Fastest stop: {pit_stops_df['Duration'].min():.2f}s")
print(f"Slowest stop: {pit_stops_df['Duration'].max():.2f}s")
# Plot pit stop timing
fig, ax = plt.subplots(figsize=(14, 8))
colors = tif1.plotting.get_driver_color_mapping(session)
for driver in top_5_drivers:
driver_stops = pit_stops_df[pit_stops_df["Driver"] == driver]
if len(driver_stops) > 0:
ax.scatter(
driver_stops["Lap"],
[driver] * len(driver_stops),
s=200,
color=colors.get(driver, "#ffffff"),
edgecolor="white",
linewidth=2,
zorder=3
)
ax.set_xlabel("Lap Number")
ax.set_ylabel("Driver")
ax.set_title("Pit Stop Timing - Top 5 Finishers")
ax.grid(True, alpha=0.3, axis="x")
plt.tight_layout()
plt.show()
```
## 8. Race Pace Comparison
Compare race pace between drivers on same compound.
```python theme={"theme":{"light":"github-light","dark":"github-dark"}}
def compare_race_pace(laps, drivers, compound="MEDIUM"):
"""Compare race pace for specific drivers on same compound."""
fig, ax = plt.subplots(figsize=(14, 6))
colors = tif1.plotting.get_driver_color_mapping(session)
for driver in drivers:
driver_laps = clean_laps[
(clean_laps["Driver"] == driver) &
(clean_laps["Compound"] == compound)
].copy()
if len(driver_laps) == 0:
continue
# Plot lap times vs tire life
ax.scatter(
driver_laps["TyreLife"],
driver_laps["LapTime"],
color=colors.get(driver, "#ffffff"),
label=driver,
alpha=0.6,
s=50
)
# Add trend line
if len(driver_laps) >= 3:
from scipy import stats
slope, intercept, _, _, _ = stats.linregress(
driver_laps["TyreLife"],
driver_laps["LapTime"]
)
x_trend = range(int(driver_laps["TyreLife"].min()), int(driver_laps["TyreLife"].max()) + 1)
y_trend = [slope * x + intercept for x in x_trend]
ax.plot(x_trend, y_trend, color=colors.get(driver, "#ffffff"), linestyle="--", alpha=0.8)
ax.set_xlabel("Tire Life (laps)")
ax.set_ylabel("Lap Time (s)")
ax.set_title(f"Race Pace Comparison - {compound} Compound")
ax.legend()
ax.grid(True, alpha=0.3)
plt.tight_layout()
plt.show()
compare_race_pace(laps, top_5_drivers[:3], compound="MEDIUM")
```
## 9. Generate Race Report
Create a comprehensive race summary.
```python theme={"theme":{"light":"github-light","dark":"github-dark"}}
def generate_race_report(session, laps):
"""Generate a comprehensive race report."""
print("=" * 60)
print(f"RACE REPORT: {session.event['EventName']} {session.year}")
print("=" * 60)
# Winner
final_lap = laps[laps["LapNumber"] == laps["LapNumber"].max()]
winner = final_lap.sort_values("Position").iloc[0]
print(f"\n🏆 Winner: {winner['Driver']} ({winner['Team']})")
# Fastest lap
fastest = laps.loc[laps["LapTime"].idxmin()]
print(f"⚡ Fastest Lap: {fastest['Driver']} - Lap {fastest['LapNumber']} - {fastest['LapTime']:.3f}s")
# Race statistics
print(f"\n📊 Race Statistics:")
print(f" Total Laps: {laps['LapNumber'].max()}")
print(f" Classified Finishers: {len(final_lap)}")
# Pit stops
pit_stops = laps[laps["PitInTime"].notna()]
print(f" Total Pit Stops: {len(pit_stops)}")
# Top 5
print(f"\n🏁 Top 5 Finishers:")
top_5 = final_lap.sort_values("Position").head(5)
for _, driver in top_5.iterrows():
print(f" {int(driver['Position'])}. {driver['Driver']} ({driver['Team']})")
print("\n" + "=" * 60)
generate_race_report(session, laps)
```
## Summary
This complete race analysis workflow covers:
1. Race overview and basic statistics
2. Position changes throughout the race
3. Lap time analysis and consistency
4. Tire strategy visualization
5. Stint-by-stint degradation analysis
6. Gap to leader tracking
7. Pit stop analysis
8. Race pace comparison
9. Comprehensive race report
You can adapt these patterns to analyze any race in the tif1 database (2018-current).
***
## Related Pages
Analyze qualifying
Weather analysis
API reference
More examples