> ## Documentation Index
> Fetch the complete documentation index at: https://tif1.tracinginsights.com/llms.txt
> Use this file to discover all available pages before exploring further.
# Why tif1 instead of fastf1?
> A fact-checked comparison of tif1 and fastf1: no rate limits, lazy fetching, 22 chart helpers, no IP restrictions, and mini-sector data.
`fastf1` is the de-facto standard library for Formula 1 data in Python. The fastf1 project has done much for the F1 data community. `tif1` started as a personal project with a different philosophy in a few areas. These areas are data-fetch granularity, API rate limits, ready-made charts, CDN-based access, and extra data.
`tif1` keeps a fastf1-compatible API, so the two libraries feel familiar side by side. This fact-checked comparison helps with that decision.
## Comparison at a Glance
| Feature | fastf1 | tif1 |
| :-------------------- | :------------------------------------------------------------------------------------------------- | :--------------------------------------------------------- |
| **Data source** | F1 live-timing API + Ergast-compatible jolpica-f1 API | TracingInsights static data on a free global CDN |
| **Granularity** | Whole-session `session.load()` required | Lazy, fine-grained — fetch one lap of telemetry directly |
| **Rate limits** | Yes — jolpica-f1 caps at **500 requests/hour** (4 req/s burst); live-timing API can throttle/block | **None** — static CDN files, no quotas, no API keys |
| **IP restrictions** | Live-timing endpoints may block VPNs and data-center IPs | None — works from any IP via global CDNs |
| **Built-in charts** | Manual matplotlib chart code | **22 optional one-call chart helpers** |
| **Mini-sector data** | Not in the public API | Included (race-control mini-sectors + enriched lap splits) |
| **Backends** | pandas only | pandas **and** polars |
| **Caching** | File-based pickle cache | SQLite persistent cache + in-memory LRU |
| **Network** | HTTP/1.1, sequential | HTTP/2, asynchronous, multi-CDN fallback |
| **Data availability** | \~20-25 min after session | \~30 min after session (more enrichment) |
| **Live timing** | Supported | Archive only (2018-current) |
***
## 1. Fetch Only the Necessary Data — No Full-Session Downloads
### The fastf1 approach
`fastf1` is session-oriented by design. `session.load()` fetches the entire session up front:
```python theme={"theme":{"light":"github-light","dark":"github-dark"}}
import fastf1
session = fastf1.get_session(2025, "Monaco", "R")
session.load() # Downloads EVERYTHING: all drivers, all laps, all telemetry
```
For a single race, that means tens of megabytes of JSON per driver across all 20 drivers. Weather, track status, race control messages, and more add to the volume. Loading telemetry for all drivers alone is typically **100-300 HTTP requests**. That volume is reasonable for a full-weekend analysis. Most of it goes unused when the analysis needs only a few laps.
### The tif1 approach: lazy and fine-grained
In `tif1`, a session is a lightweight object. Data is fetched only when a property is accessed, and only the files needed for that access:
```python theme={"theme":{"light":"github-light","dark":"github-dark"}}
import tif1
session = tif1.get_session(2021, "Belgian Grand Prix", "Race")
# No session.load() needed — this pulls a single, small JSON file.
telemetry = session.get_driver("VER").get_lap(19).telemetry
print(telemetry[["Time", "Speed", "Throttle"]].head())
```
### Why it matters
* **Faster iteration** — first results appear in seconds, not minutes.
* **Disk space** — the cache stores only the files actually used.
* **Bandwidth and energy** — fewer transferred bytes reduce the environmental load, especially at scale.
* **Predictable cost** — one lap equals one file. One session needs only a few files.
***
## 2. No API rate limits — a verified 500 requests/hour ceiling on fastf1's data source
### The 500 requests/hour limit, verified
`fastf1` obtains its data from two upstream sources:
1. The **F1 live-timing API** (unofficial, for telemetry and timing feeds).
2. The **Ergast-compatible jolpica-f1 API** (open source, for lap times, results, and historical data). It replaces the old Ergast API, which was limited to roughly 250 requests per hour per IP.
The jolpica-f1 [Rate Limits guide](https://github.com/jolpica/jolpica-f1/blob/main/docs/rate_limits.md) documents the following for unauthenticated access:
* **Burst limit:** 4 requests per second
* **Sustained limit: 500 requests per hour**
Requests above the limits receive `HTTP 429 Too Many Requests` with the message *"Request was throttled"*. The [Terms of Use](https://github.com/jolpica/jolpica-f1/blob/main/TERMS.md) add that abuse or excessive use may result in temporary or permanent blocking. The same terms note that the limits decrease in the future as token-based access rolls out.
The live-timing endpoints used for telemetry are not a public service. They are known to throttle and block clients that make too many requests.
### When the limit matters
The 500 requests/hour ceiling is a real constraint worth planning around. Load patterns that can approach it include:
* loops over an entire season (24 weekends × several sessions),
* comparisons of a full grid across multiple races,
* backtests or model training on many sessions,
* background jobs that warm a cache.
These patterns can approach 500 requests quickly, especially with whole-session loads. This scenario led to the creation of `tif1` for the app at [tracinginsights.com/analysis](https://tracinginsights.com/analysis).
### Why tif1 has no rate limits
`tif1` does not depend on those APIs for distribution. It serves pre-processed static JSON files from public GitHub data repositories (`TracingInsights/{year}`). Distribution runs through **jsDelivr (primary)**, **Hugging Face buckets (fallback)**, and **StaticDelivr (backup)**. These free CDNs distribute open-source software worldwide.
The result:
* No API keys or accounts
* No per-user or per-IP request quotas
* No throttling on burst traffic
* Automatic CDN failover, retries, and a circuit breaker built in
* SQLite and in-memory LRU caching, so repeat accesses do not hit the network
Load any amount of data without watching a request counter.
***
## 3. Charts Included — 22 Optional One-Call Chart Helpers
Many users build visualizations by hand from fastf1's raw DataFrames. For quick, repeatable plots, `tif1` additionally bundles `plot_*()` helpers that handle the loading, filtering, and styling:
### Real examples from the tif1 tutorials
```python theme={"theme":{"light":"github-light","dark":"github-dark"}}
import tif1
import matplotlib.pyplot as plt
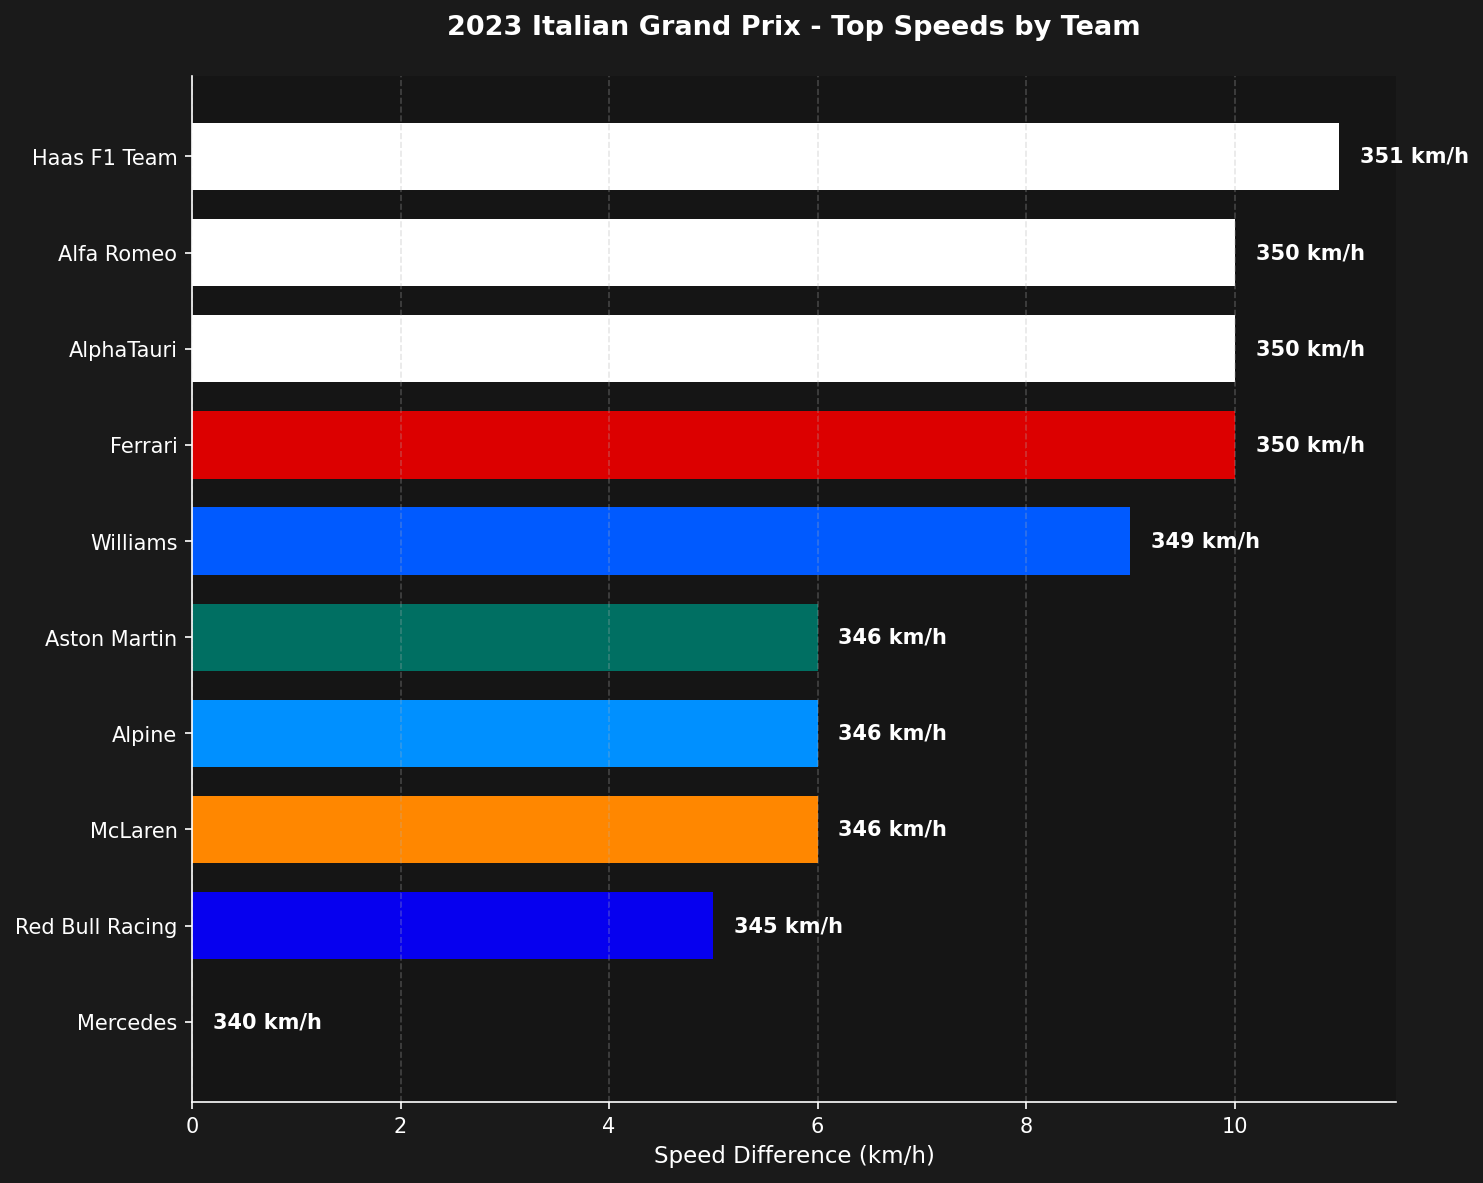
# Top speeds by team at the 2023 Italian Grand Prix qualifying.
# Loads the session, auto-detects the fastest trap, and plots team maxima.
fig, ax = tif1.plot_top_speeds(2023, "Italian Grand Prix", "Q")
plt.show()
# Alonso's lap times at the 2023 Azerbaijan Grand Prix, colored by tire compound.
fig, ax = tif1.plot_driver_laptimes(2023, "Azerbaijan", "R", drivers=["ALO"])
plt.show()
# 4-panel speed / longitudinal-g / lateral-g / driver-actions comparison.
fig, ax = tif1.plot_telemetry_comparison(2024, "Monaco", "Q", drivers=["VER", "LEC"])
plt.show()
# Or save straight to a file — no interactive session required.
tif1.plot_laptime_heatmap(2023, "Monaco Grand Prix", "R", save_path="monaco_heatmap.png")
```
 ### The full chart family
| Category | Functions |
| :--------------- | :------------------------------------------------------------------------------------------------------------------------------------------------------------------- |
| **Track maps** | `plot_track_speed_map`, `plot_track_throttle_map`, `plot_track_brake_zones`, `plot_track_acceleration_map`, `plot_gear_shifts`, `plot_multi_driver_speed_comparison` |
| **Telemetry** | `plot_speed_traces`, `plot_annotated_speed_trace`, `plot_telemetry_comparison`, `plot_gg_diagram` |
| **Lap analysis** | `plot_driver_laptimes`, `plot_laptime_heatmap`, `plot_laptimes_distribution`, `plot_lap_delta`, `plot_position_changes` |
| **Performance** | `plot_downforce_levels`, `plot_throttle_distance`, `plot_tire_degradation`, `plot_qualifying_grid`, `plot_track_temperature` |
| **Speeds** | `plot_top_speeds` |
Every chart accepts shared filters: year, event, session, drivers/teams, save path, and DPI. Every chart also has a matching tutorial in the [Tutorials](/tutorials/race-analysis) section.
***
## 4. Works from anywhere — no IP restrictions
### IP restrictions on the live-timing endpoints
fastf1's telemetry flows come from the official F1 live-timing infrastructure, which is an internal service. Community discussions report that these endpoints reject requests from some sources:
* **VPNs are sometimes blocked** — common VPN/proxy IP ranges may be rejected.
* **Data-center and cloud IPs are sometimes blocked** — a VPS, cloud function, or CI runner can require workarounds.
* **Residential-IP workarounds** appear in discussions for users who encounter these blocks.
These blocks do not affect every user. Users who encounter them see the benefit of CDN-based delivery.
### The tif1 approach: global CDNs, no IP checks
`tif1` serves files from **StaticDelivr** and **jsDelivr**, with **Hugging Face buckets** as a last-resort backup. These free CDNs serve millions of websites every day. CDNs are built to serve content to the entire internet, so there are:
* No IP allowlists or blocks
* No VPN/proxy detection
* No residential-IP requirements
* No keys, cookies, or sessions
Any network can pull tif1 data identically and at the same speed. Home broadband, a university campus, AWS/GCP/Azure, a Raspberry Pi, or a GitHub Actions runner all work. The CDN edge is close to every user.
***
## 5. Extra data — mini sectors and more
### Mini-sector data
Formula 1 timing divides a lap into 3 sectors. Each sector divides into **8 mini-sectors** — 24 mini-sectors around the lap. Mini-sector timing shows where drivers gain and lose time more precisely than the three conventional sectors. Teams and broadcasters use it for detailed performance analysis.
fastf1's public API focuses on lap timing, telemetry, and results. The TracingInsights data pipeline behind tif1 provides a few extras outside that scope:
* **Race-control messages** include the affected mini-sector in the `Sector` column (`1-24`), for example a yellow flag in mini-sector 12. Flags are tracked per mini-sector, not just per conventional sector.
* **Lap data** is enriched with mini-sector splits sourced from OpenF1 for per-lap resolution below the S1/S2/S3 level.
In tif1:
```python theme={"theme":{"light":"github-light","dark":"github-dark"}}
import tif1
session = tif1.get_session(2024, "Monaco Grand Prix", "Race")
# Race-control messages carry the affected mini-sector (1-24).
rcm = session.race_control_messages
print(rcm[["Time", "Message", "Flag", "Sector"]].head())
```
### A few more extras
| Capability | Details |
| :------------------------ | :------------------------------------------------------------------------------------------ |
| **Per-lap weather** | Air/track temperature, humidity, rainfall, wind merged into every lap row — no joins needed |
| **Derived telemetry** | `DriverAhead`, `DistanceToDriverAhead`, and `AccelerationX/Y/Z` computed and included |
| **Acceleration channels** | Longitudinal, lateral, and vertical g-forces from position/speed data |
| **Polars backend** | The same data usable on the polars engine for 2x faster analytics |
| **SQLite + LRU cache** | Persistent cache survives restarts; memory LRU makes repeat loads nearly instant |
| **Async fetching** | HTTP/2 parallel downloads with multi-CDN fallback and a circuit breaker |
| **Jupyter-ready** | Rich HTML rendering of sessions, laps, and telemetry in notebooks |
| **CLI** | `tif1` command-line tools for schedules, data inspection, and cache management |
***
## Honest trade-offs: when fastf1 still makes sense
Both libraries have strengths, and fastf1 remains the better choice in a few situations:
* **Live timing.** tif1 is an archive library (2018-current). Real-time lap and telemetry data during a live session needs fastf1.
* **Freshest data.** tif1 data is published \~30 minutes after a session ends, versus \~20-25 minutes for fastf1. The 2-5 minute gap pays for enrichment and processing.
* **Deep fastf1-internal dependencies.** A codebase that relies on fastf1 internals beyond the documented API surface (for example `fastf1.ergast`, `fastf1.livetiming`) needs those specific modules. tif1 does not include them.
## Migration
Because tif1 keeps the fastf1-compatible schema (same column names, types, and ordering), migrating is typically a one-line import change:
```python theme={"theme":{"light":"github-light","dark":"github-dark"}}
import tif1 as ff1 # keep the rest of your code untouched
```
See the [Migration from fastf1](/migration-from-fastf1) guide for the step-by-step walkthrough, or jump straight into the [Quickstart](/quickstart).
Load a first session in under 30 seconds.
Browse all 22 native chart functions.
Move an existing fastf1 project to tif1.
See tif1 charts applied to real race analysis.
### The full chart family
| Category | Functions |
| :--------------- | :------------------------------------------------------------------------------------------------------------------------------------------------------------------- |
| **Track maps** | `plot_track_speed_map`, `plot_track_throttle_map`, `plot_track_brake_zones`, `plot_track_acceleration_map`, `plot_gear_shifts`, `plot_multi_driver_speed_comparison` |
| **Telemetry** | `plot_speed_traces`, `plot_annotated_speed_trace`, `plot_telemetry_comparison`, `plot_gg_diagram` |
| **Lap analysis** | `plot_driver_laptimes`, `plot_laptime_heatmap`, `plot_laptimes_distribution`, `plot_lap_delta`, `plot_position_changes` |
| **Performance** | `plot_downforce_levels`, `plot_throttle_distance`, `plot_tire_degradation`, `plot_qualifying_grid`, `plot_track_temperature` |
| **Speeds** | `plot_top_speeds` |
Every chart accepts shared filters: year, event, session, drivers/teams, save path, and DPI. Every chart also has a matching tutorial in the [Tutorials](/tutorials/race-analysis) section.
***
## 4. Works from anywhere — no IP restrictions
### IP restrictions on the live-timing endpoints
fastf1's telemetry flows come from the official F1 live-timing infrastructure, which is an internal service. Community discussions report that these endpoints reject requests from some sources:
* **VPNs are sometimes blocked** — common VPN/proxy IP ranges may be rejected.
* **Data-center and cloud IPs are sometimes blocked** — a VPS, cloud function, or CI runner can require workarounds.
* **Residential-IP workarounds** appear in discussions for users who encounter these blocks.
These blocks do not affect every user. Users who encounter them see the benefit of CDN-based delivery.
### The tif1 approach: global CDNs, no IP checks
`tif1` serves files from **StaticDelivr** and **jsDelivr**, with **Hugging Face buckets** as a last-resort backup. These free CDNs serve millions of websites every day. CDNs are built to serve content to the entire internet, so there are:
* No IP allowlists or blocks
* No VPN/proxy detection
* No residential-IP requirements
* No keys, cookies, or sessions
Any network can pull tif1 data identically and at the same speed. Home broadband, a university campus, AWS/GCP/Azure, a Raspberry Pi, or a GitHub Actions runner all work. The CDN edge is close to every user.
***
## 5. Extra data — mini sectors and more
### Mini-sector data
Formula 1 timing divides a lap into 3 sectors. Each sector divides into **8 mini-sectors** — 24 mini-sectors around the lap. Mini-sector timing shows where drivers gain and lose time more precisely than the three conventional sectors. Teams and broadcasters use it for detailed performance analysis.
fastf1's public API focuses on lap timing, telemetry, and results. The TracingInsights data pipeline behind tif1 provides a few extras outside that scope:
* **Race-control messages** include the affected mini-sector in the `Sector` column (`1-24`), for example a yellow flag in mini-sector 12. Flags are tracked per mini-sector, not just per conventional sector.
* **Lap data** is enriched with mini-sector splits sourced from OpenF1 for per-lap resolution below the S1/S2/S3 level.
In tif1:
```python theme={"theme":{"light":"github-light","dark":"github-dark"}}
import tif1
session = tif1.get_session(2024, "Monaco Grand Prix", "Race")
# Race-control messages carry the affected mini-sector (1-24).
rcm = session.race_control_messages
print(rcm[["Time", "Message", "Flag", "Sector"]].head())
```
### A few more extras
| Capability | Details |
| :------------------------ | :------------------------------------------------------------------------------------------ |
| **Per-lap weather** | Air/track temperature, humidity, rainfall, wind merged into every lap row — no joins needed |
| **Derived telemetry** | `DriverAhead`, `DistanceToDriverAhead`, and `AccelerationX/Y/Z` computed and included |
| **Acceleration channels** | Longitudinal, lateral, and vertical g-forces from position/speed data |
| **Polars backend** | The same data usable on the polars engine for 2x faster analytics |
| **SQLite + LRU cache** | Persistent cache survives restarts; memory LRU makes repeat loads nearly instant |
| **Async fetching** | HTTP/2 parallel downloads with multi-CDN fallback and a circuit breaker |
| **Jupyter-ready** | Rich HTML rendering of sessions, laps, and telemetry in notebooks |
| **CLI** | `tif1` command-line tools for schedules, data inspection, and cache management |
***
## Honest trade-offs: when fastf1 still makes sense
Both libraries have strengths, and fastf1 remains the better choice in a few situations:
* **Live timing.** tif1 is an archive library (2018-current). Real-time lap and telemetry data during a live session needs fastf1.
* **Freshest data.** tif1 data is published \~30 minutes after a session ends, versus \~20-25 minutes for fastf1. The 2-5 minute gap pays for enrichment and processing.
* **Deep fastf1-internal dependencies.** A codebase that relies on fastf1 internals beyond the documented API surface (for example `fastf1.ergast`, `fastf1.livetiming`) needs those specific modules. tif1 does not include them.
## Migration
Because tif1 keeps the fastf1-compatible schema (same column names, types, and ordering), migrating is typically a one-line import change:
```python theme={"theme":{"light":"github-light","dark":"github-dark"}}
import tif1 as ff1 # keep the rest of your code untouched
```
See the [Migration from fastf1](/migration-from-fastf1) guide for the step-by-step walkthrough, or jump straight into the [Quickstart](/quickstart).
Load a first session in under 30 seconds.
Browse all 22 native chart functions.
Move an existing fastf1 project to tif1.
See tif1 charts applied to real race analysis.