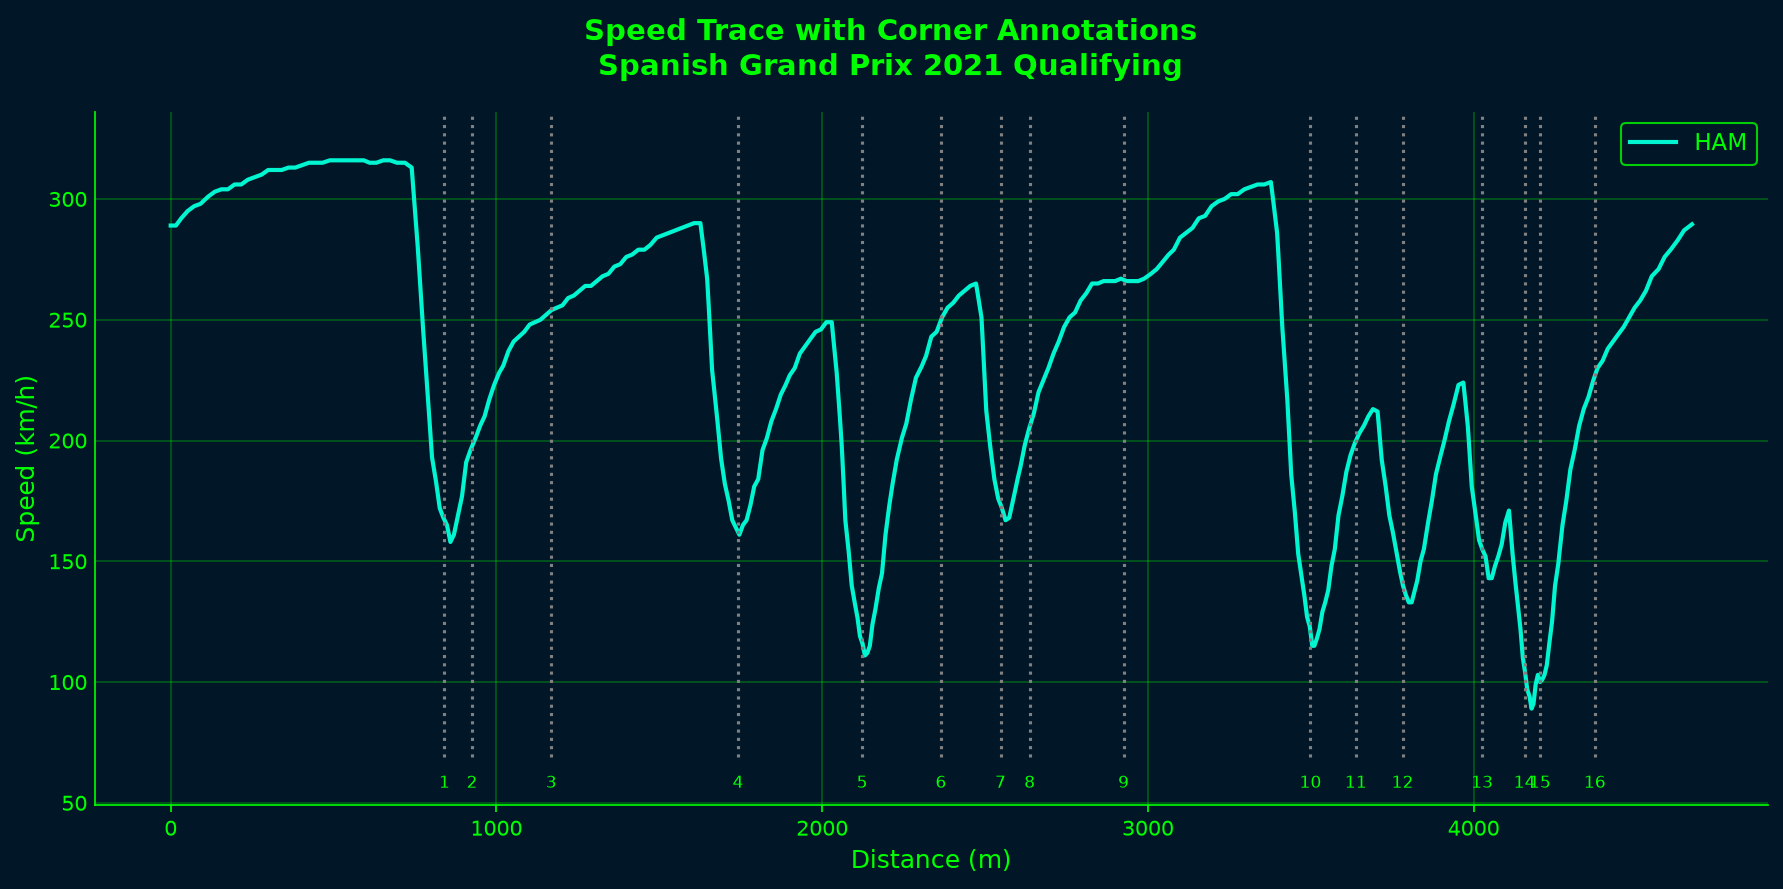
Visualize speed traces with corner markers and annotations
Identify where speed changes occur on a circuit. These locations have a large effect on lap time. Annotate a speed trace with corner locations to show braking zones, apex speeds, and acceleration patterns at specific corners.
Corner entry speeds: Where the speed drops before each corner marker
Minimum corner speeds: The lowest point near each corner number
Corner exit acceleration: How quickly speed increases after each corner
Straight-line performance: Speed plateaus between corners
For example, Turn 1 at Barcelona typically shows a sharp speed drop from ~310 km/h to ~150 km/h. The high-speed Turn 9 maintains speeds above 250 km/h.
The native speed traces chart overlays the fastest laps of several drivers on a shared distance axis:
import tif1# Overlay the fastest laps of two driversfig, ax = tif1.plot_speed_traces(2023, 'Spanish Grand Prix', 'Q', drivers=['VER', 'HAM'])plt.show()
The whole workflow above is wrapped in a single native function:
import tif1import matplotlib.pyplot as plt# One call: loads the session, fetches circuit info, and annotates the cornersfig, ax = tif1.plot_annotated_speed_trace(2021, 'Spanish Grand Prix', 'Q')plt.show()# Or save straight to a file# tif1.plot_annotated_speed_trace(2021, 'Spanish Grand Prix', 'Q', save_path='annotated_speed_trace.png')