

Setup
import tif1
import pandas as pd
import matplotlib.pyplot as plt
import seaborn as sns

# Configure plotting
tif1.plotting.setup_mpl(color_scheme="fastf1")
sns.set_style("darkgrid")

# Load race session
session = tif1.get_session(2024, "Abu Dhabi Grand Prix", "Race")
laps = session.laps
1. Race Overview
Start with a high-level overview of the race.# Basic race statistics
print(f"Total laps: {laps['LapNumber'].max()}")
print(f"Drivers: {len(laps['Driver'].unique())}")
print(f"Total lap records: {len(laps)}")
# Race winner
final_lap = laps[laps["LapNumber"] == laps["LapNumber"].max()]
winner = final_lap.sort_values("Position").iloc[0]
print(f"\nRace Winner: {winner['Driver']} ({winner['Team']})")
# Fastest lap
fastest = laps.loc[laps["LapTime"].idxmin()]
print(f"Fastest Lap: {fastest['Driver']} - Lap {fastest['LapNumber']} - {fastest['LapTime'].total_seconds():.3f}s")
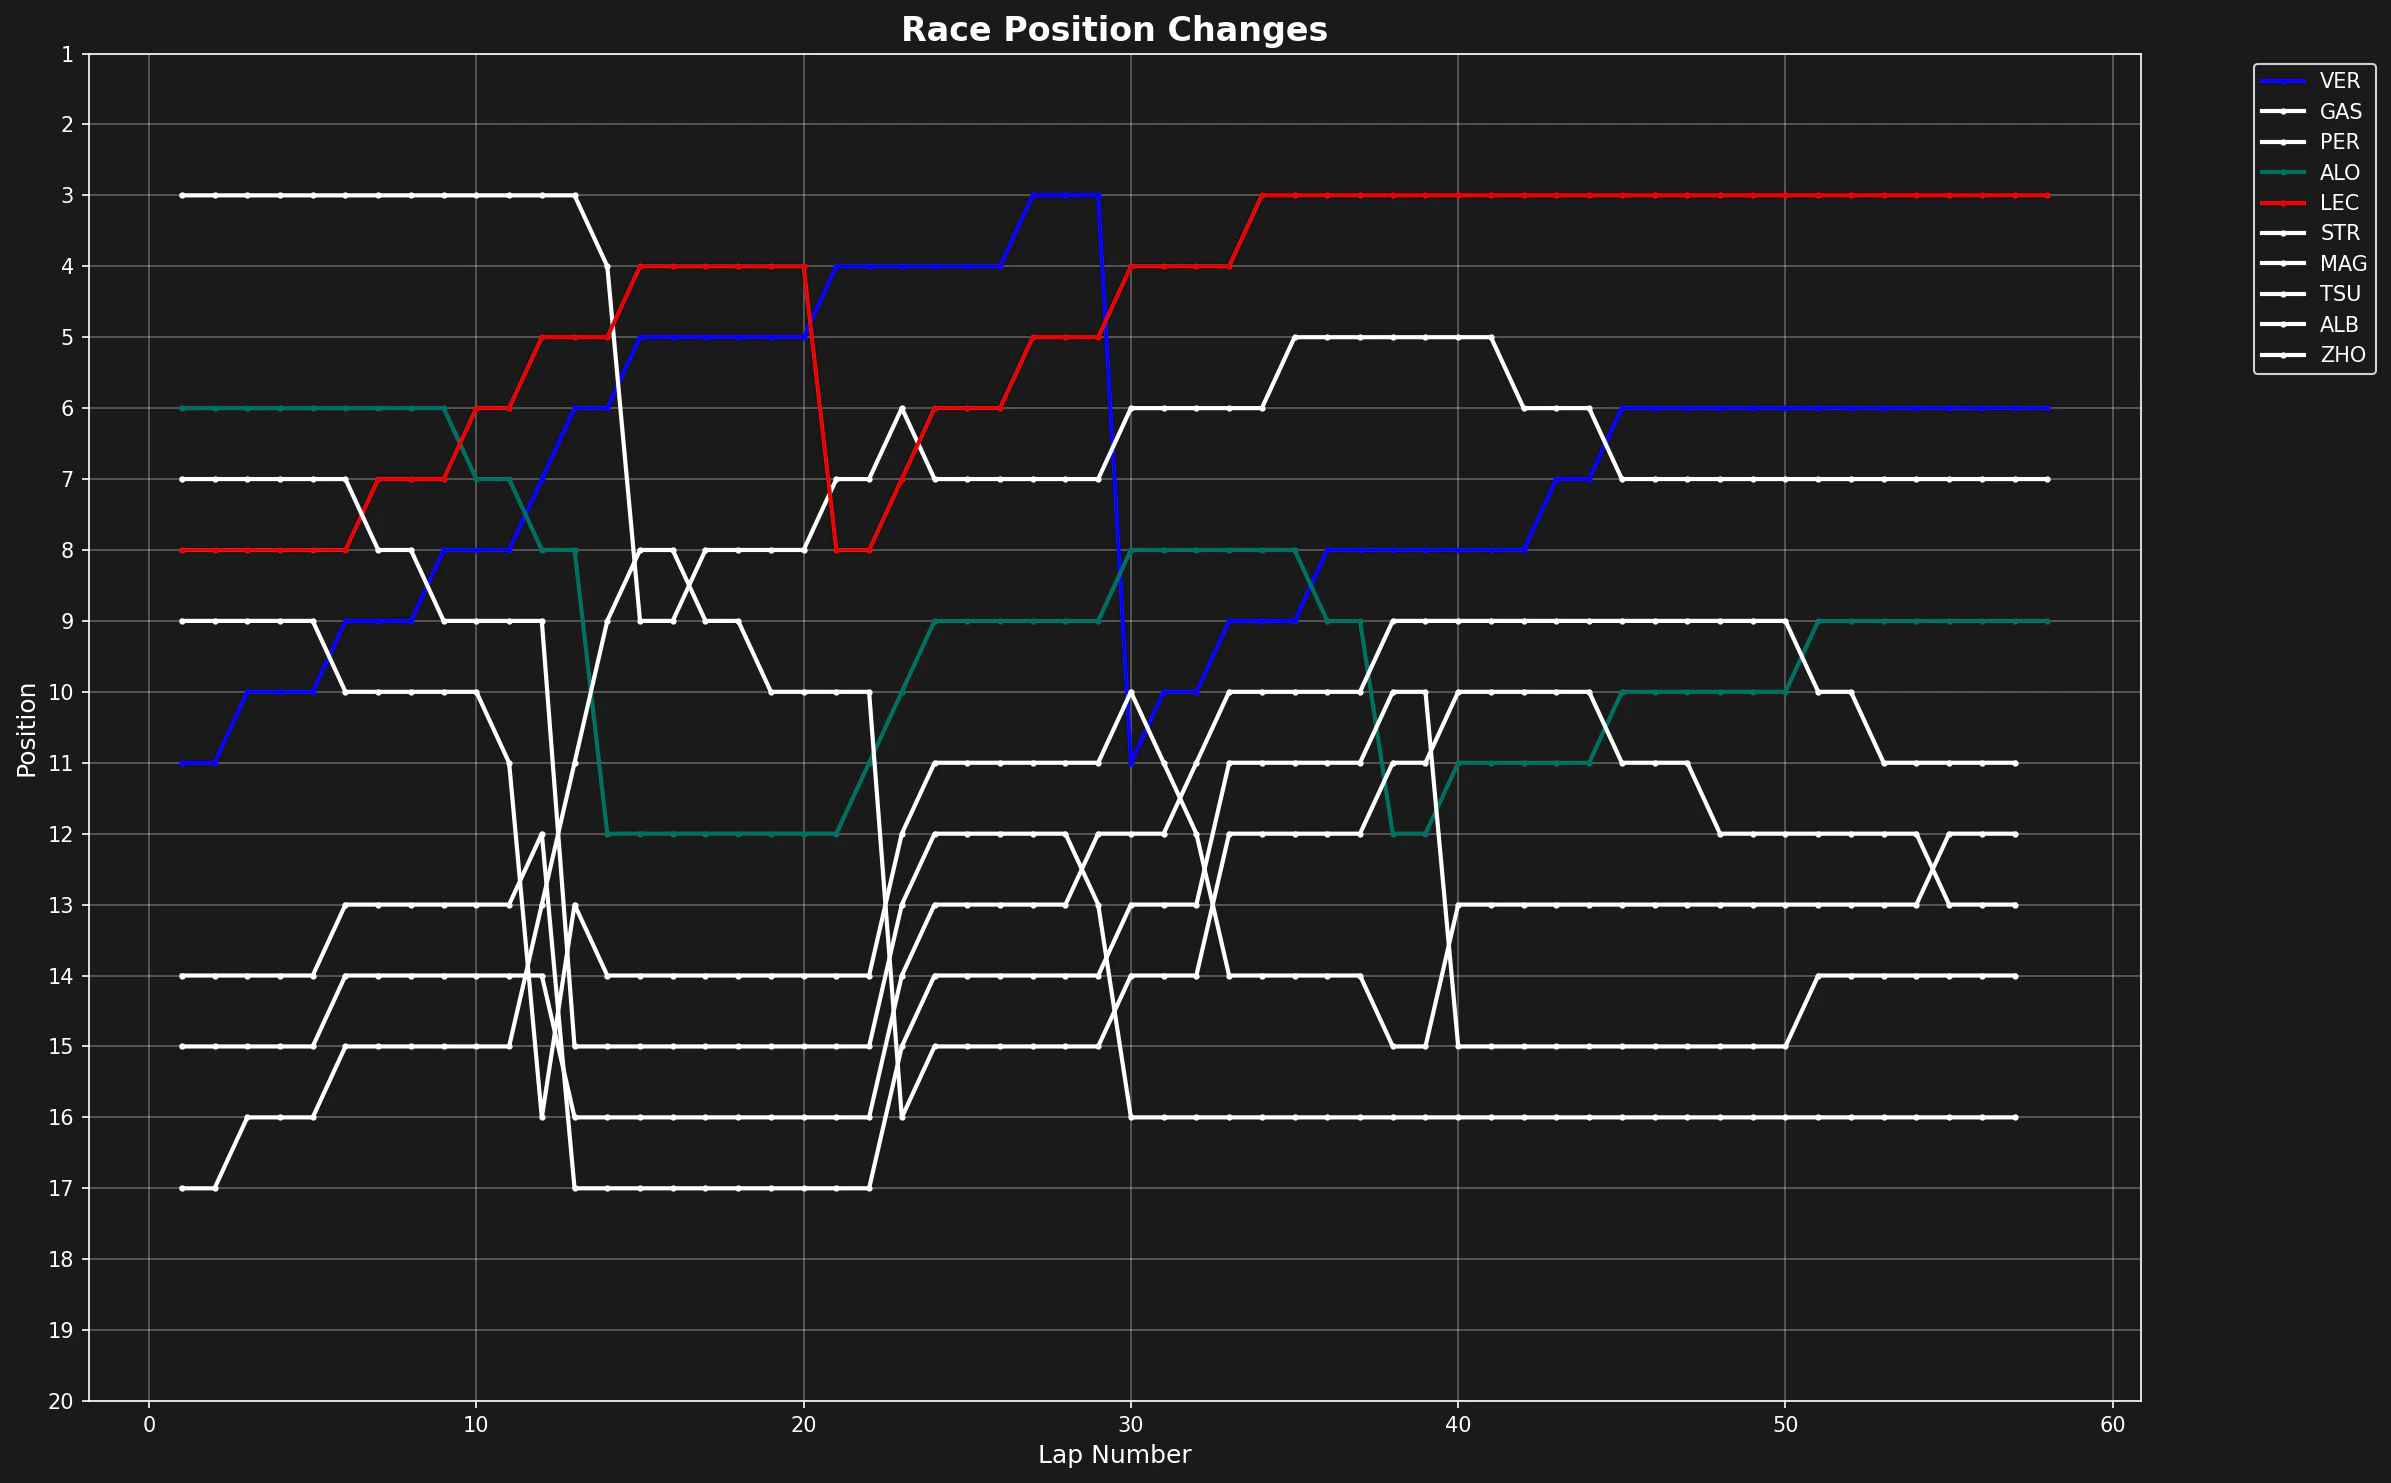
2. Position Changes
Visualize how positions changed throughout the race.def plot_position_changes(laps):
"""Plot position changes for all drivers."""
fig, ax = plt.subplots(figsize=(16, 10))
colors = tif1.plotting.get_driver_color_mapping(session)
for driver in laps["Driver"].unique():
driver_laps = laps[laps["Driver"] == driver].sort_values("LapNumber")
ax.plot(
driver_laps["LapNumber"],
driver_laps["Position"],
label=driver,
color=colors.get(driver, "#ffffff"),
linewidth=2,
marker="o",
markersize=3
)
ax.set_xlabel("Lap Number", fontsize=12)
ax.set_ylabel("Position", fontsize=12)
ax.set_title("Race Position Changes", fontsize=16, fontweight="bold")
ax.invert_yaxis() # Position 1 at top
ax.set_yticks(range(1, 21))
ax.grid(True, alpha=0.3)
ax.legend(bbox_to_anchor=(1.05, 1), loc="upper left", fontsize=10)
plt.tight_layout()
plt.show()
plot_position_changes(laps)
3. Lap Time Analysis
Analyze lap time distributions and consistency.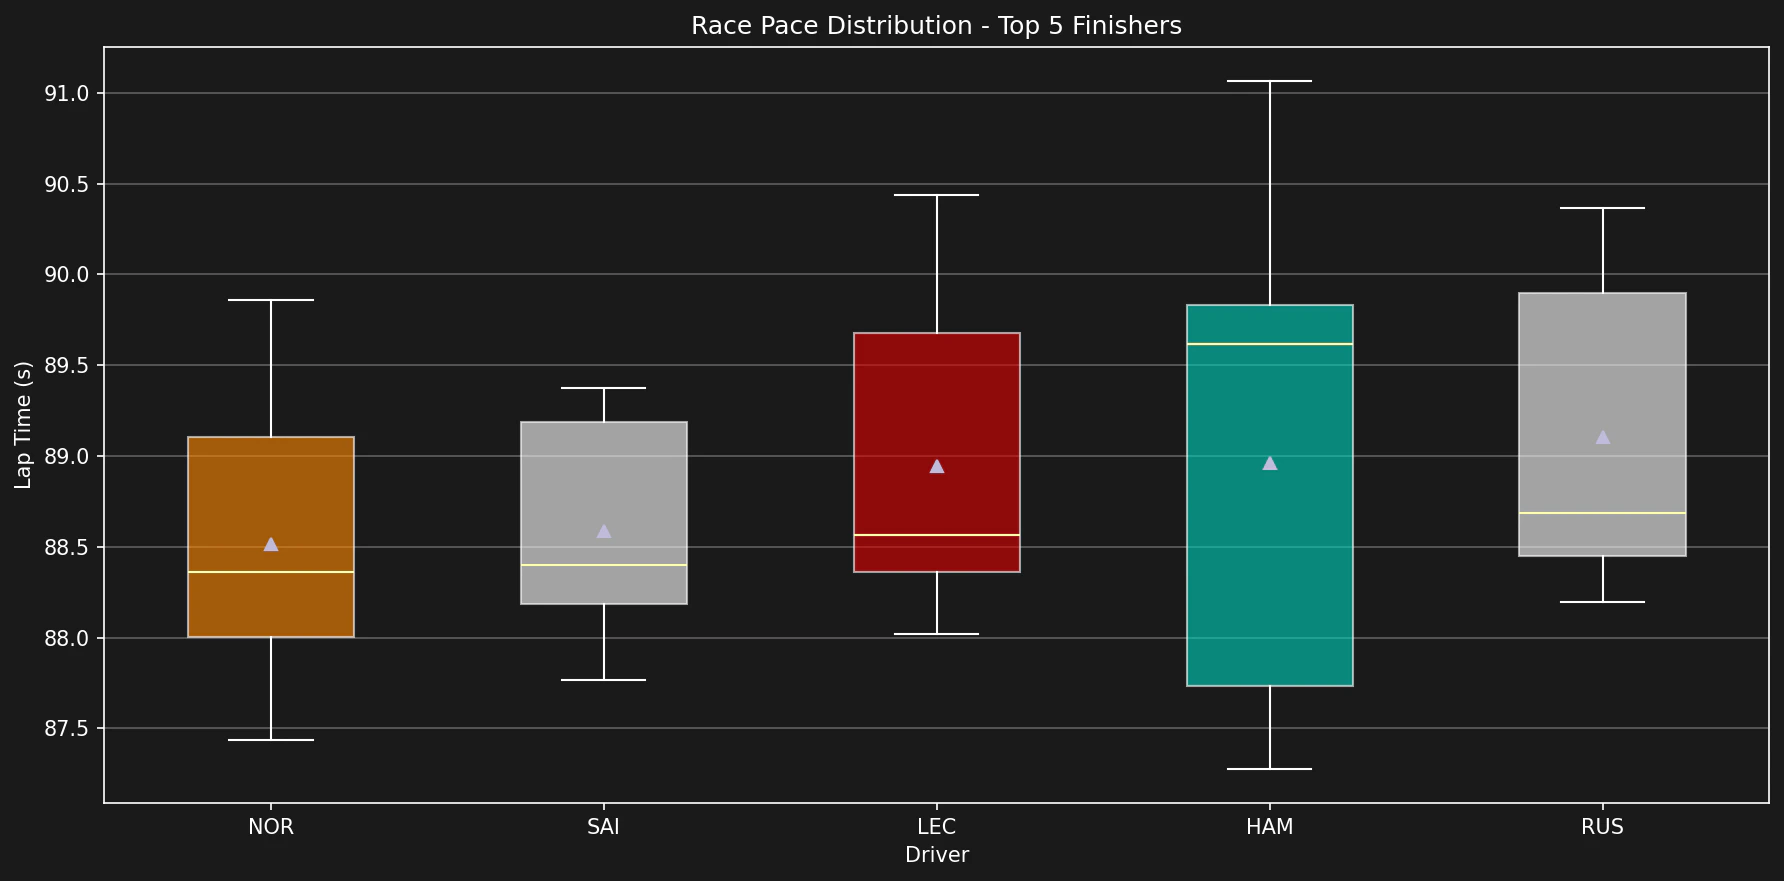
def clean_race_laps(laps):
    """Remove invalid laps for race pace analysis."""
    clean = laps.copy()

    # Remove pit laps
    clean = clean[clean["PitInTime"].isna() & clean["PitOutTime"].isna()]

    # Remove lap 1 (standing start)
    clean = clean[clean["LapNumber"] > 1]

    # Remove very slow laps (safety car, incidents)
    fastest = clean["LapTime"].min()
    clean = clean[clean["LapTime"] < fastest * 1.15]

    # Remove deleted laps
    clean = clean[~clean["Deleted"]]

    return clean

clean_laps = clean_race_laps(laps)

# Top 5 finishers
final_positions = laps[laps["LapNumber"] == laps["LapNumber"].max()].sort_values("Position")
top_5_drivers = final_positions.head(5)["Driver"].tolist()

# Box plot of lap times (matplotlib needs numeric values, so convert to seconds)
fig, ax = plt.subplots(figsize=(12, 6))
top_5_laps = clean_laps[clean_laps["Driver"].isin(top_5_drivers)].copy()
top_5_laps["LapTimeSeconds"] = top_5_laps["LapTime"].dt.total_seconds()

colors_list = [tif1.plotting.get_driver_color(d, session=session) for d in top_5_drivers]

bp = ax.boxplot(
    [top_5_laps[top_5_laps["Driver"] == d]["LapTimeSeconds"] for d in top_5_drivers],
    tick_labels=top_5_drivers,
    patch_artist=True,
    showmeans=True
)

for patch, color in zip(bp["boxes"], colors_list):
    patch.set_facecolor(color)
    patch.set_alpha(0.6)

ax.set_xlabel("Driver")
ax.set_ylabel("Lap Time (s)")
ax.set_title("Race Pace Distribution - Top 5 Finishers")
ax.grid(True, alpha=0.3, axis="y")
plt.tight_layout()
plt.show()
4. Tire Strategy
Analyze tire strategy and stint lengths.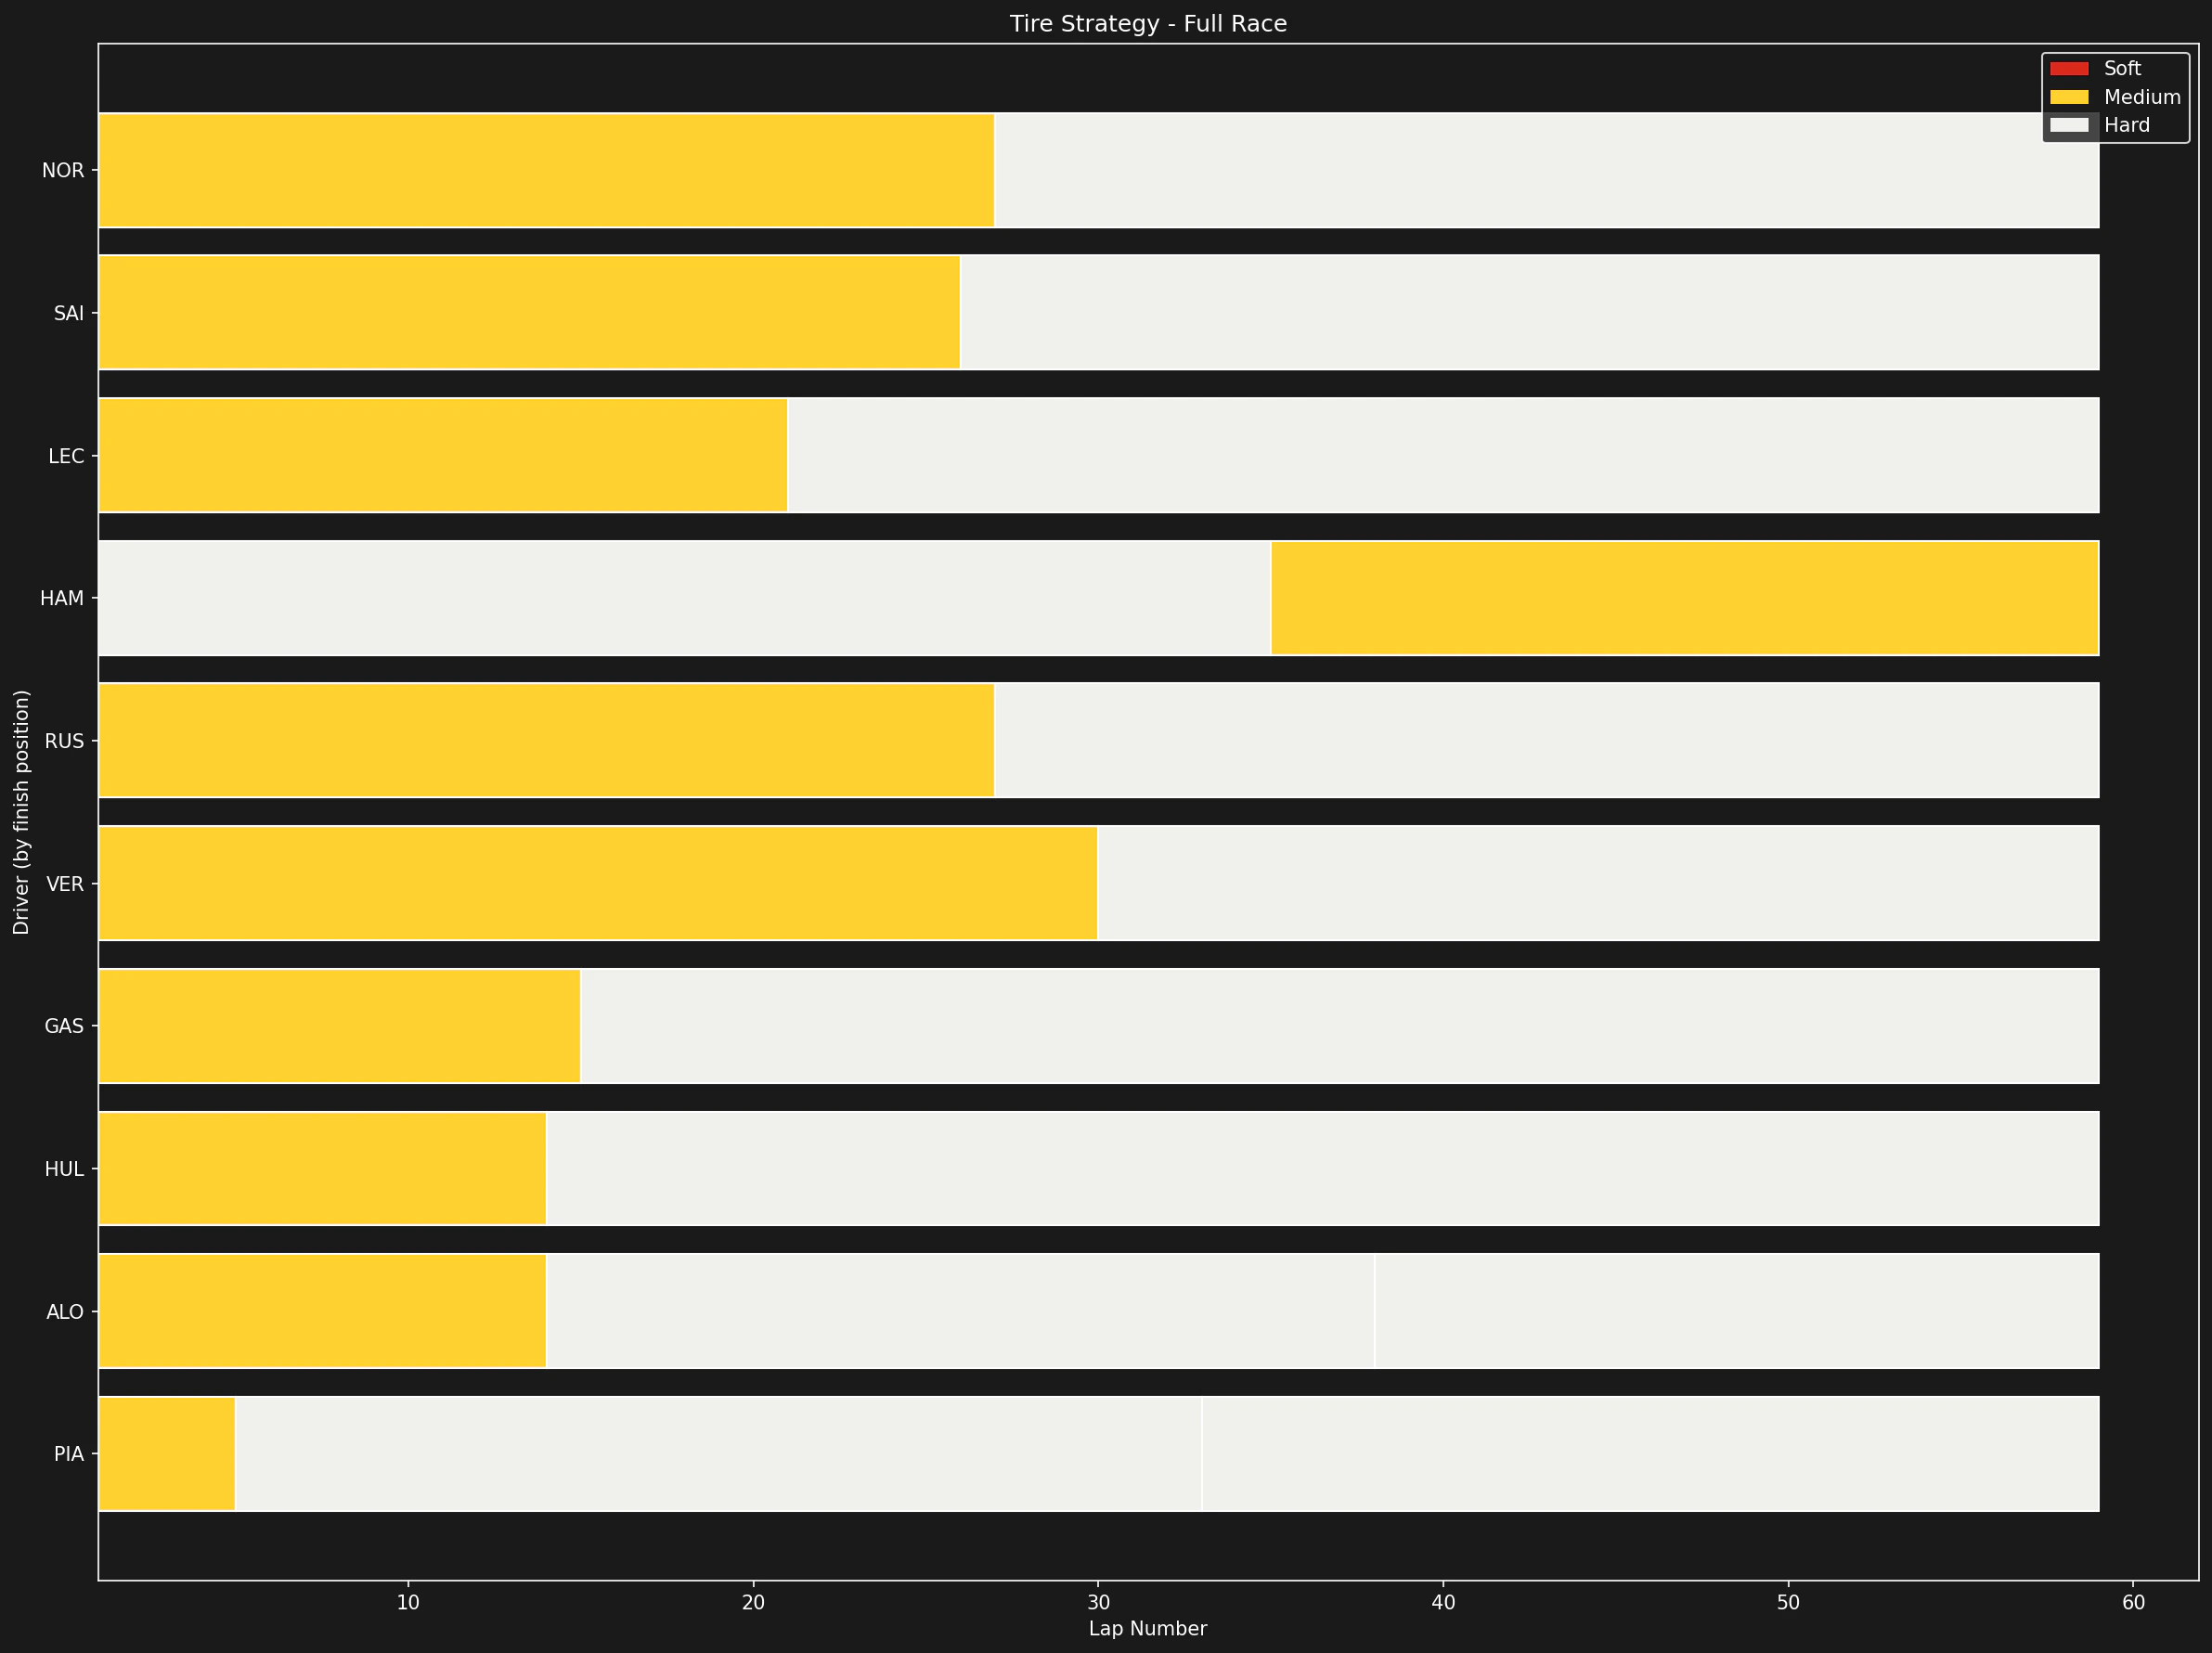
def plot_tire_strategy(laps):
    """Visualize tire strategy for all drivers."""
    fig, ax = plt.subplots(figsize=(16, 12))

    # Get final classification
    final_lap = laps[laps["LapNumber"] == laps["LapNumber"].max()]
    drivers_sorted = final_lap.sort_values("Position")["Driver"].tolist()

    compound_colors = tif1.plotting.get_compound_mapping(session=session)

    for idx, driver in enumerate(drivers_sorted):
        driver_laps = laps[laps["Driver"] == driver].sort_values("LapNumber")

        for stint in driver_laps["Stint"].unique():
            stint_laps = driver_laps[driver_laps["Stint"] == stint]
            compound = stint_laps["Compound"].iloc[0]

            start_lap = stint_laps["LapNumber"].min()
            end_lap = stint_laps["LapNumber"].max()

            ax.barh(
                y=idx,
                width=end_lap - start_lap + 1,
                left=start_lap,
                height=0.8,
                color=compound_colors.get(compound, "#888888"),
                edgecolor="white",
                linewidth=1
            )

    ax.set_yticks(range(len(drivers_sorted)))
    ax.set_yticklabels(drivers_sorted)
    ax.set_xlabel("Lap Number")
    ax.set_ylabel("Driver (by finish position)")
    ax.set_title("Tire Strategy - Full Race")
    ax.invert_yaxis()

    # Legend
    from matplotlib.patches import Patch
    legend_elements = [
        Patch(facecolor=compound_colors["SOFT"], label="Soft"),
        Patch(facecolor=compound_colors["MEDIUM"], label="Medium"),
        Patch(facecolor=compound_colors["HARD"], label="Hard"),
    ]
    ax.legend(handles=legend_elements, loc="upper right")

    plt.tight_layout()
    plt.show()

plot_tire_strategy(laps)
5. Stint Analysis
Analyze tire degradation within stints.def analyze_stint_degradation(laps, driver, stint):
"""Analyze tire degradation for a specific stint."""
stint_laps = laps[
(laps["Driver"] == driver) &
(laps["Stint"] == stint) &
(laps["PitInTime"].isna())
].copy()
if len(stint_laps) < 3:
return None
# Linear regression (scipy needs numeric values, so convert to seconds)
from scipy import stats
lap_seconds = stint_laps["LapTime"].dt.total_seconds()
slope, intercept, r_value, _, _ = stats.linregress(
stint_laps["TyreLife"],
lap_seconds
)
return {
"driver": driver,
"stint": stint,
"compound": stint_laps["Compound"].iloc[0],
"laps": len(stint_laps),
"degradation": slope,
"r_squared": r_value ** 2,
"avg_time": stint_laps["LapTime"].mean(),
}
# Analyze all stints for top 3
results = []
for driver in top_5_drivers[:3]:
driver_laps = laps[laps["Driver"] == driver]
for stint in driver_laps["Stint"].unique():
result = analyze_stint_degradation(laps, driver, stint)
if result:
results.append(result)
# Display results
import pandas as pd
df_results = pd.DataFrame(results)
print("\nStint Degradation Analysis:")
print(df_results.to_string(index=False))
6. Gap to Leader
Calculate and visualize gap to race leader over time.def calculate_gap_to_leader(laps):
"""Calculate gap to leader for each lap."""
gaps = []
for lap_num in laps["LapNumber"].unique():
lap_data = laps[laps["LapNumber"] == lap_num].copy()
# Find leader
leader = lap_data[lap_data["Position"] == 1]
if len(leader) == 0:
continue
# The laps DataFrame stores the session time at lap completion in "Time"
leader_time = leader["Time"].iloc[0]
# Calculate gaps (store as seconds for plotting)
for _, row in lap_data.iterrows():
gap = (row["Time"] - leader_time).total_seconds()
gaps.append({
"LapNumber": lap_num,
"Driver": row["Driver"],
"Position": row["Position"],
"GapToLeader": gap,
})
return pd.DataFrame(gaps)
gaps_df = calculate_gap_to_leader(laps)
# Plot gap evolution for top 5
fig, ax = plt.subplots(figsize=(16, 8))
colors = tif1.plotting.get_driver_color_mapping(session)
for driver in top_5_drivers:
driver_gaps = gaps_df[gaps_df["Driver"] == driver]
ax.plot(
driver_gaps["LapNumber"],
driver_gaps["GapToLeader"],
label=driver,
color=colors.get(driver, "#ffffff"),
linewidth=2
)
ax.set_xlabel("Lap Number")
ax.set_ylabel("Gap to Leader (s)")
ax.set_title("Gap to Leader - Top 5 Finishers")
ax.legend()
ax.grid(True, alpha=0.3)
plt.tight_layout()
plt.show()
7. Pit Stop Analysis
Analyze pit stop timing and duration.def analyze_pit_stops(laps):
"""Extract and analyze pit stop data."""
pit_stops = []
for driver in laps["Driver"].unique():
driver_laps = laps[laps["Driver"] == driver].sort_values("LapNumber")
# Find pit laps (where PitInTime is not null)
pit_laps = driver_laps[driver_laps["PitInTime"].notna()]
for _, pit_lap in pit_laps.iterrows():
pit_stops.append({
"Driver": driver,
"Lap": pit_lap["LapNumber"],
"PitInTime": pit_lap["PitInTime"],
"PitOutTime": pit_lap["PitOutTime"],
"Duration": pit_lap["PitOutTime"] - pit_lap["PitInTime"] if pd.notna(pit_lap["PitOutTime"]) else None,
"Stint": pit_lap["Stint"],
})
return pd.DataFrame(pit_stops)
pit_stops_df = analyze_pit_stops(laps)
if len(pit_stops_df) > 0:
print("\nPit Stop Summary:")
print(f"Total pit stops: {len(pit_stops_df)}")
print(f"Average duration: {pit_stops_df['Duration'].mean().total_seconds():.2f}s")
print(f"Fastest stop: {pit_stops_df['Duration'].min().total_seconds():.2f}s")
print(f"Slowest stop: {pit_stops_df['Duration'].max().total_seconds():.2f}s")
# Plot pit stop timing
fig, ax = plt.subplots(figsize=(14, 8))
colors = tif1.plotting.get_driver_color_mapping(session)
for driver in top_5_drivers:
driver_stops = pit_stops_df[pit_stops_df["Driver"] == driver]
if len(driver_stops) > 0:
ax.scatter(
driver_stops["Lap"],
[driver] * len(driver_stops),
s=200,
color=colors.get(driver, "#ffffff"),
edgecolor="white",
linewidth=2,
zorder=3
)
ax.set_xlabel("Lap Number")
ax.set_ylabel("Driver")
ax.set_title("Pit Stop Timing - Top 5 Finishers")
ax.grid(True, alpha=0.3, axis="x")
plt.tight_layout()
plt.show()
8. Race Pace Comparison
Compare race pace between drivers on the same compound.def compare_race_pace(laps, drivers, compound="MEDIUM"):
"""Compare race pace for specific drivers on same compound."""
fig, ax = plt.subplots(figsize=(14, 6))
colors = tif1.plotting.get_driver_color_mapping(session)
for driver in drivers:
driver_laps = clean_laps[
(clean_laps["Driver"] == driver) &
(clean_laps["Compound"] == compound)
].copy()
if len(driver_laps) == 0:
continue
# Plot lap times vs tire life (matplotlib needs seconds, not timedelta)
lap_seconds = driver_laps["LapTime"].dt.total_seconds()
ax.scatter(
driver_laps["TyreLife"],
lap_seconds,
color=colors.get(driver, "#ffffff"),
label=driver,
alpha=0.6,
s=50
)
# Add trend line
if len(driver_laps) >= 3:
from scipy import stats
slope, intercept, _, _, _ = stats.linregress(
driver_laps["TyreLife"],
lap_seconds
)
x_trend = range(int(driver_laps["TyreLife"].min()), int(driver_laps["TyreLife"].max()) + 1)
y_trend = [slope * x + intercept for x in x_trend]
ax.plot(x_trend, y_trend, color=colors.get(driver, "#ffffff"), linestyle="--", alpha=0.8)
ax.set_xlabel("Tire Life (laps)")
ax.set_ylabel("Lap Time (s)")
ax.set_title(f"Race Pace Comparison - {compound} Compound")
ax.legend()
ax.grid(True, alpha=0.3)
plt.tight_layout()
plt.show()
compare_race_pace(laps, top_5_drivers[:3], compound="MEDIUM")
9. Generate Race Report
Create a complete race summary.def generate_race_report(session, laps):
"""Generate a comprehensive race report."""
print("=" * 60)
print(f"RACE REPORT: {session.event['EventName']} {session.year}")
print("=" * 60)
# Winner
final_lap = laps[laps["LapNumber"] == laps["LapNumber"].max()]
winner = final_lap.sort_values("Position").iloc[0]
print(f"\n🏆 Winner: {winner['Driver']} ({winner['Team']})")
# Fastest lap
fastest = laps.loc[laps["LapTime"].idxmin()]
print(f"⚡ Fastest Lap: {fastest['Driver']} - Lap {fastest['LapNumber']} - {fastest['LapTime'].total_seconds():.3f}s")
# Race statistics
print(f"\n📊 Race Statistics:")
print(f" Total Laps: {laps['LapNumber'].max()}")
print(f" Classified Finishers: {len(final_lap)}")
# Pit stops
pit_stops = laps[laps["PitInTime"].notna()]
print(f" Total Pit Stops: {len(pit_stops)}")
# Top 5
print(f"\n🏁 Top 5 Finishers:")
top_5 = final_lap.sort_values("Position").head(5)
for _, driver in top_5.iterrows():
print(f" {int(driver['Position'])}. {driver['Driver']} ({driver['Team']})")
print("\n" + "=" * 60)
generate_race_report(session, laps)
Summary
This complete race analysis workflow covers:- Race overview and basic statistics
- Position changes throughout the race
- Lap time analysis and consistency
- Tire strategy visualization
- Stint-by-stint degradation analysis
- Gap to leader tracking
- Pit stop analysis
- Race pace comparison
- Complete race report
Related Pages
Qualifying Analysis
Analyze qualifying.
Weather Impact
Weather analysis.
Core API
API reference.
Examples
More examples.