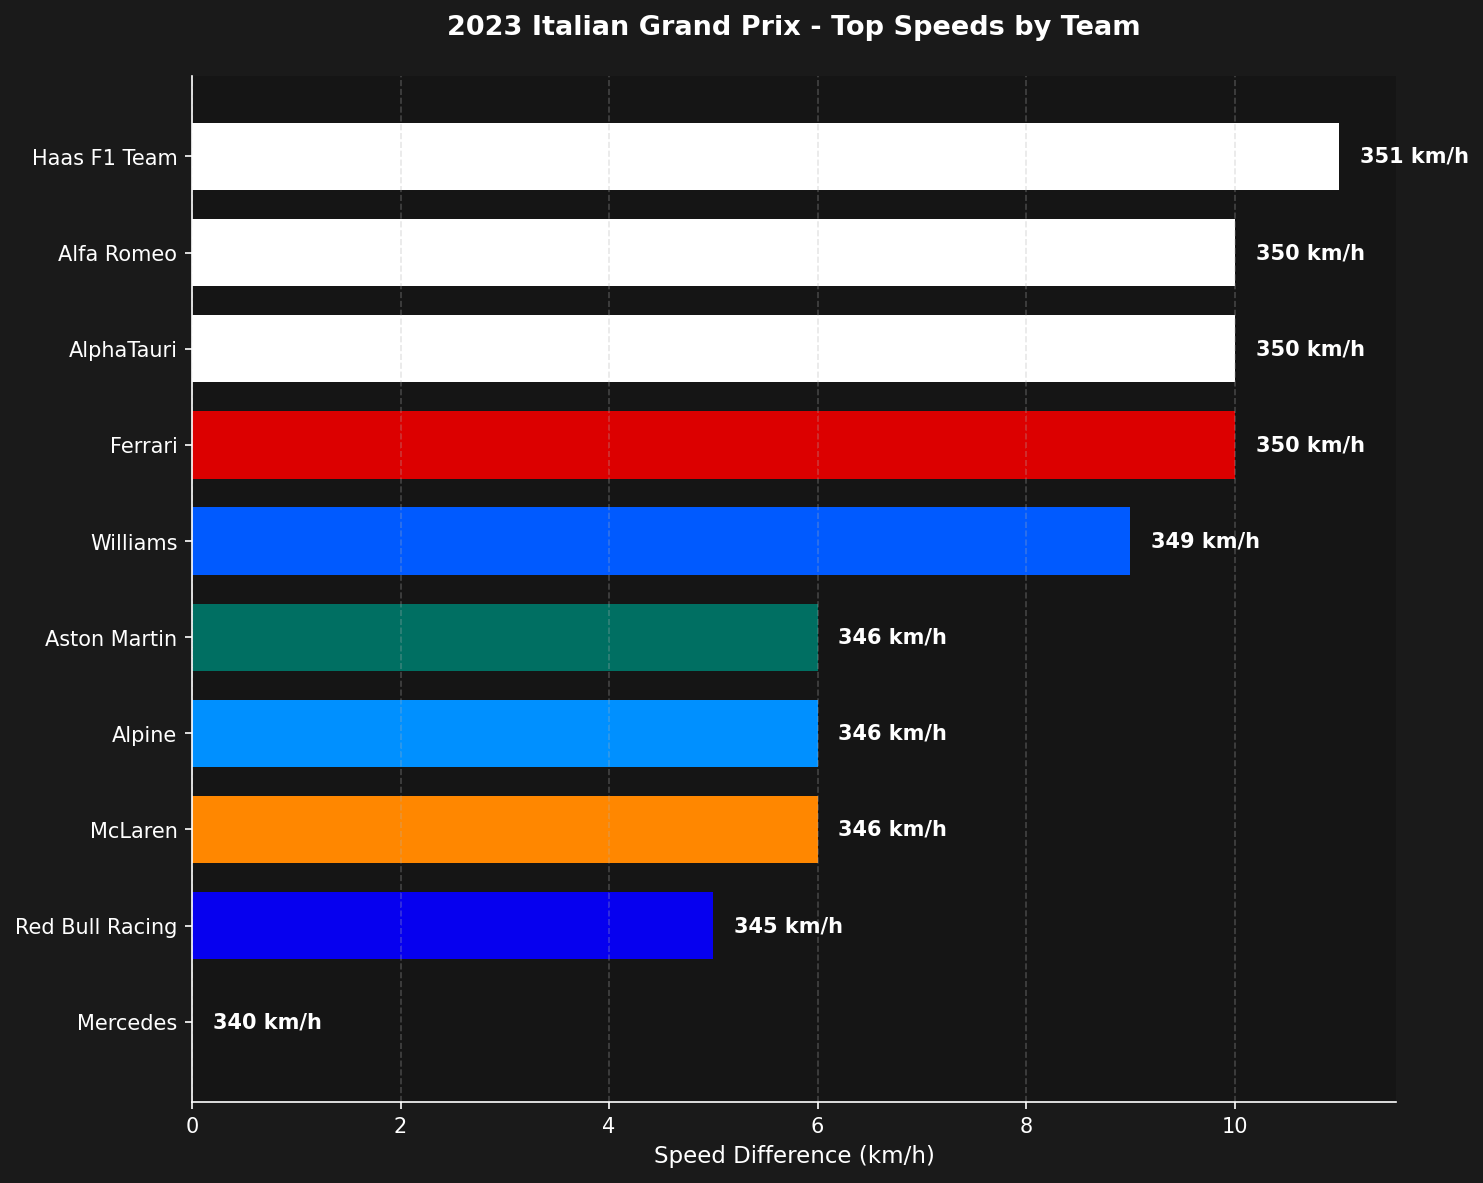
Speed trap data reveals which teams have the most powerful engines and efficient aerodynamics. Compare maximum speeds across teams to identify performance advantages on straights and understand the power unit hierarchy.
Analyze speed trap data from the 2023 Italian Grand Prix qualifying session. Top speeds are typically highest at Monza because of the low-downforce setup.
import tif1import matplotlib.pyplot as pltimport pandas as pd# Load qualifying sessionsession = tif1.get_session(2023, 'Italian Grand Prix', 'Q')
Group the data by team and find the maximum speed recorded for each.
# Prepare data with team informationteam_speeds = session.laps[[fastest_trap, 'Team']].copy()# Get maximum speed per teammax_speeds = team_speeds.groupby('Team')[fastest_trap].max().reset_index()max_speeds.columns = ['Team', 'MaxSpeed']# Sort by speedmax_speeds = max_speeds.sort_values('MaxSpeed', ascending=False)# Calculate difference from slowestmax_speeds['Diff'] = max_speeds['MaxSpeed'] - max_speeds['MaxSpeed'].min()
Use the plotting module to get official team colors for the visualization.
# Get team colorsteam_colors = {}for team in max_speeds['Team']: team_colors[team] = tif1.plotting.get_team_color(team, session=session)max_speeds['Color'] = max_speeds['Team'].map(team_colors)
The native chart exposes the shared filters. Restrict the comparison with teams, or force a specific trap with speed_trap:
import tif1# Compare selected teams at a chosen speed trapfig, ax = tif1.plot_top_speeds( 2023, 'Italian Grand Prix', 'Q', teams=['Ferrari', 'Red Bull Racing', 'Mercedes'], speed_trap='SpeedST',)plt.show()
The default speed_trap=None auto-detects the trap with the highest readings, using exactly the logic from the sections above. Omit teams (the default) to include every team.
The whole workflow above is wrapped in a single native function:
import tif1import matplotlib.pyplot as plt# One call: loads the session, detects the fastest trap, and plots team maximafig, ax = tif1.plot_top_speeds(2023, 'Italian Grand Prix', 'Q')plt.show()# Or save straight to a file# tif1.plot_top_speeds(2023, 'Italian Grand Prix', 'Q', save_path='top_speeds.png')