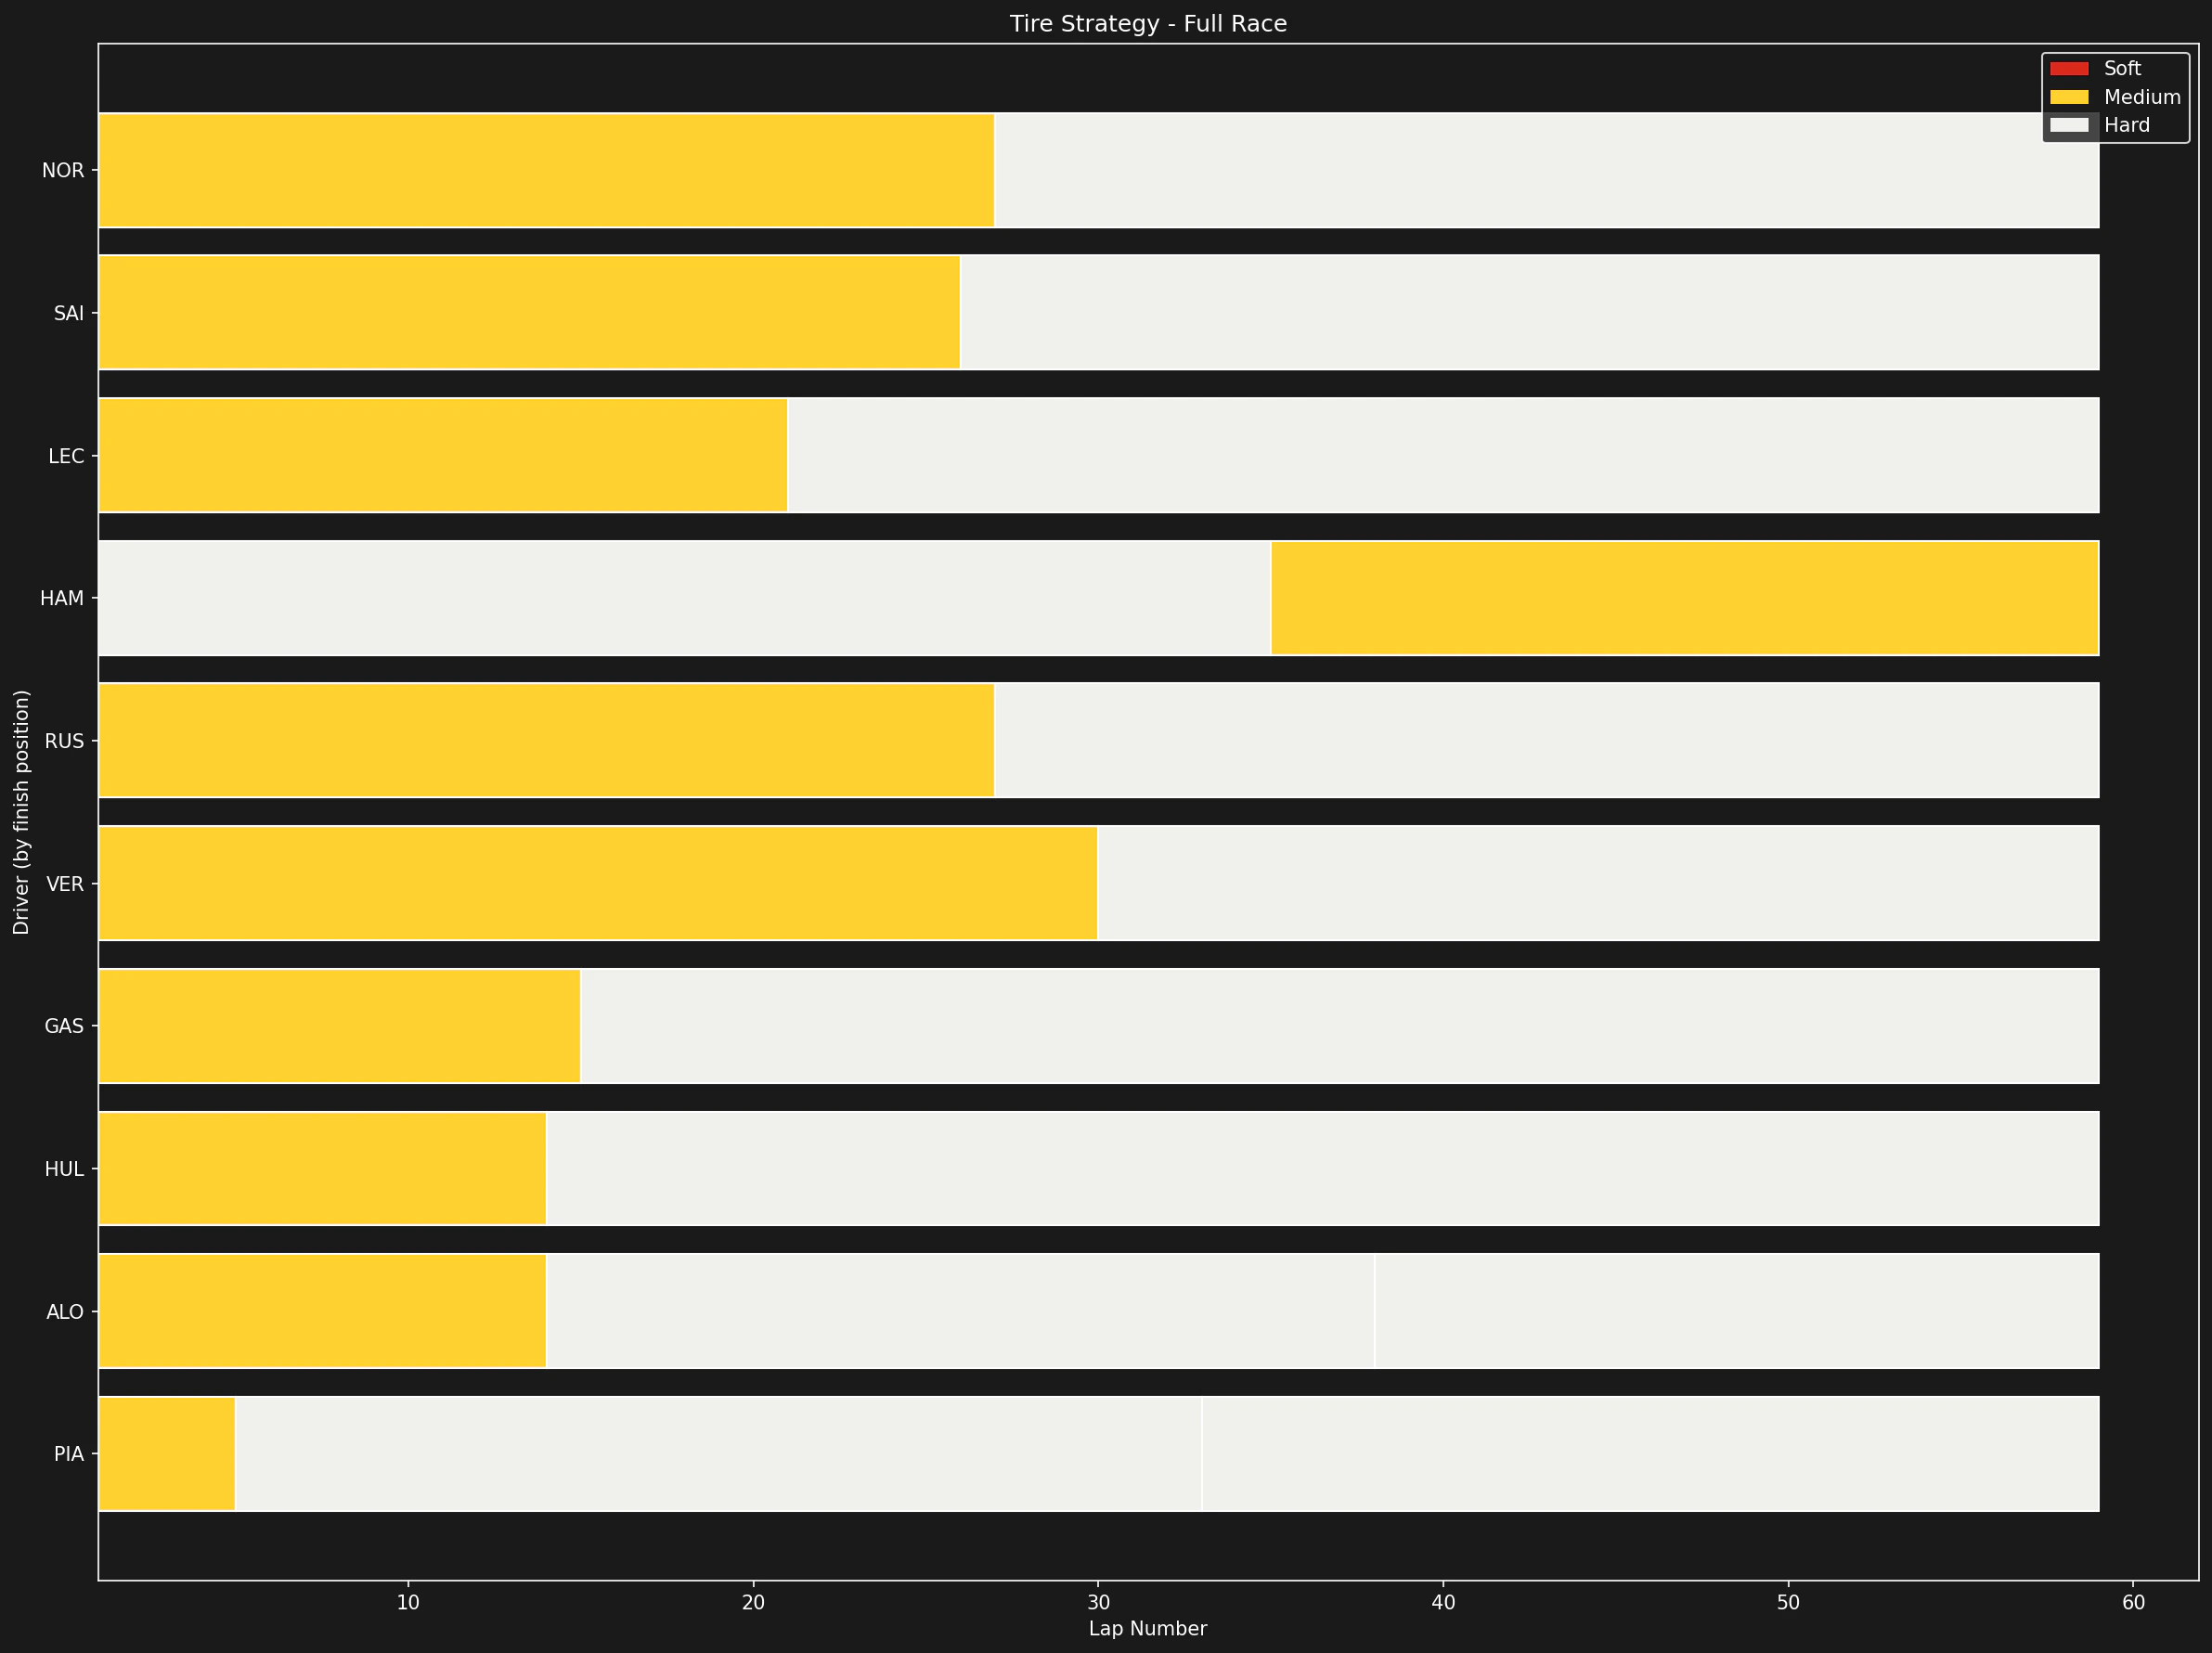
tif1 provides the Stint and Compound for every lap. Use this data to map out the entire race strategy.
import tif1import pandas as pdsession = tif1.get_session(2025, "British Grand Prix", "Race")laps = session.laps# Group by driver and stint to see strategystrategy = laps.groupby(["Driver", "Stint", "Compound"]).agg({ "LapNumber": ["min", "max", "count"]}).reset_index()print(strategy.head())
Tire degradation is the increase in lap time when the tires wear out. Calculate it from the slope of lap times during a long stint.
# Filter for a long stint (e.g., VER Stint 2)ver_stint_2 = laps[(laps["Driver"] == "VER") & (laps["Stint"] == 2)]# Simple linear regression to find degradation rate# scipy needs numeric values, so convert the timedelta lap times to secondsfrom scipy import statslap_seconds = ver_stint_2["LapTime"].dt.total_seconds()slope, intercept, r_value, p_value, std_err = stats.linregress( ver_stint_2["TyreLife"], lap_seconds)print(f"Degradation Rate: {slope:.4f} seconds per lap")
Compare the performance delta between Soft, Medium, and Hard tires.
# Average lap time per compound (cleaned)clean_laps = laps[laps["LapTime"] < laps["LapTime"].min() * 1.1]compound_performance = clean_laps.groupby("Compound")["LapTime"].mean()print(compound_performance)