

Loading Qualifying Data
Understanding Qualifying Structure
Modern F1 qualifying has three segments:- Q1: All 20 drivers, bottom 5 eliminated
- Q2: Top 15 drivers, bottom 5 eliminated
- Q3: Top 10 drivers fight for pole
Finding Fastest Laps per Driver
Get each driver’s best lap time.Visualizing the Grid
Create a visual representation of the qualifying results.Progression Through Sessions
Analyze how drivers improved from Q1 to Q3.Visualizing Progression
Show how drivers improved through the sessions.Tire Compound Analysis
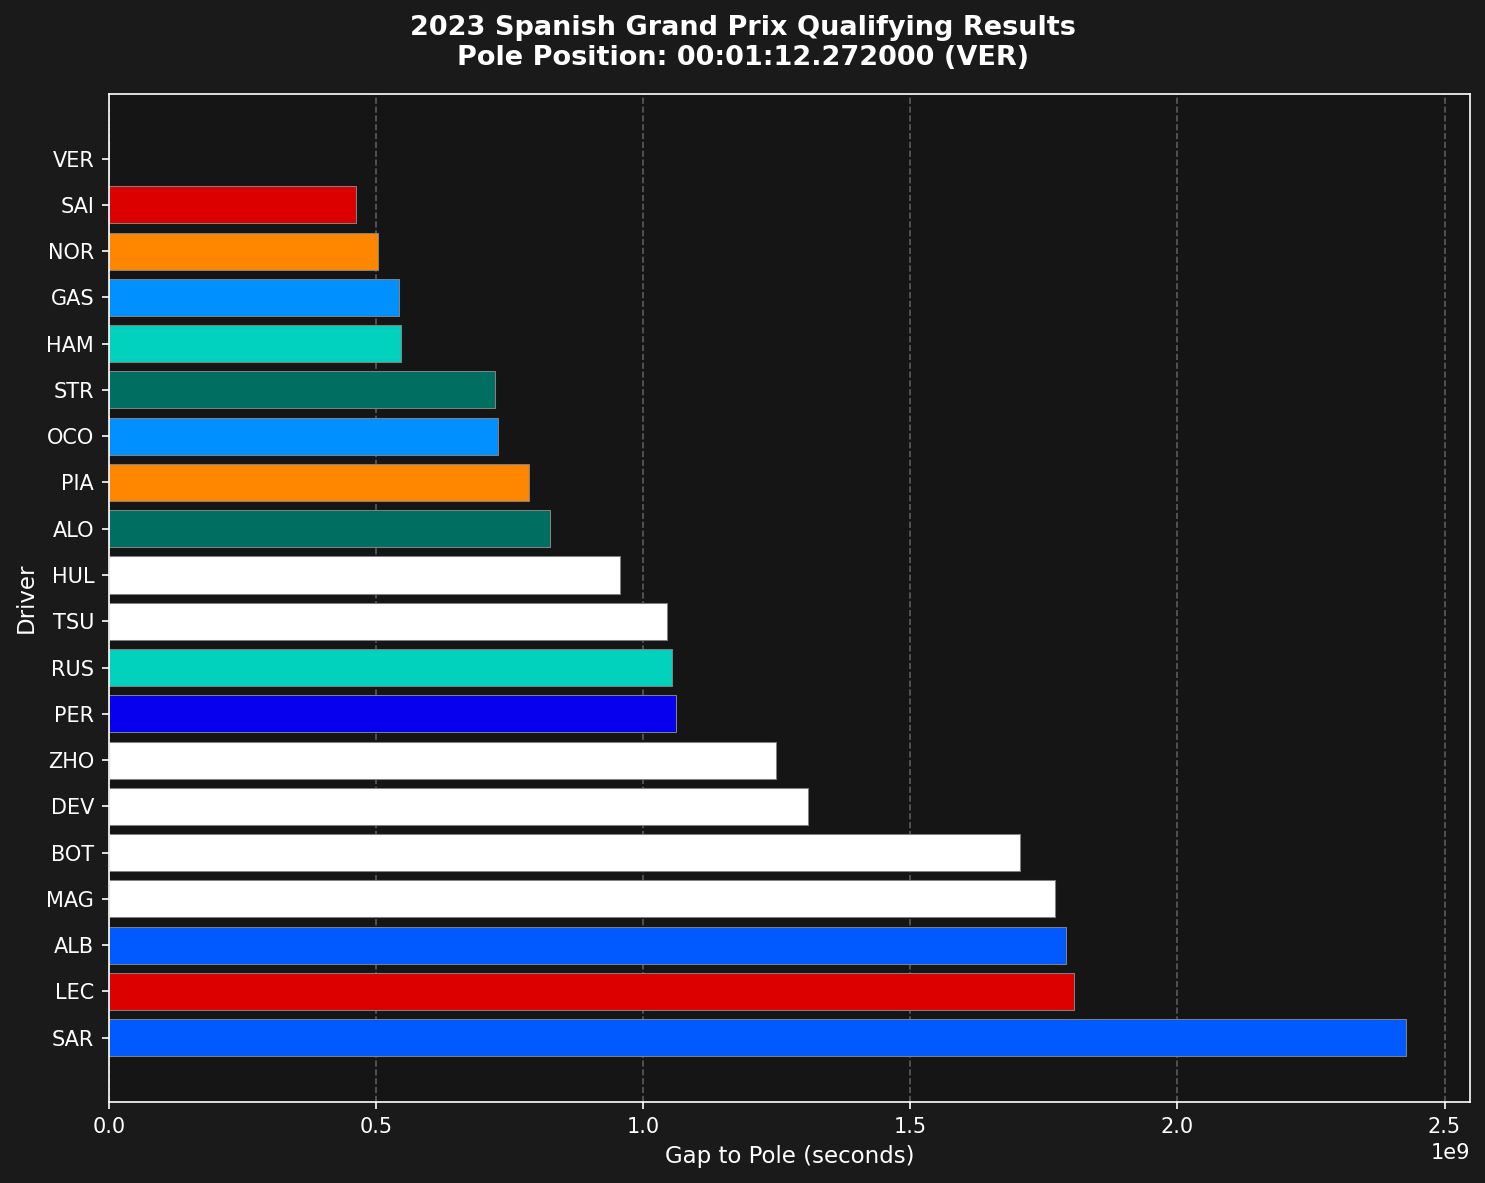
See which compounds drivers used for their fastest laps.Gap to Pole
Calculate and visualize the gap to pole position.Sector Analysis
Identify which sectors drivers are strongest in.Telemetry Comparison
Compare telemetry between pole sitter and second place.Identifying Deleted Laps
See which laps were deleted (track limits violations).Consistency Analysis
Measure driver consistency across all qualifying laps.Complete Analysis Function
Combine these steps in a reusable function.Summary
Usetif1 to:
- Identify pole position and grid order
- Track progression through Q1/Q2/Q3
- Analyze sector performance
- Compare telemetry between drivers
- Measure consistency
- Identify track limits violations
Related Pages
Race Analysis
Analyze races.
Advanced Telemetry
A detailed examination of telemetry.
Examples
More examples.